
Figure 3. Tumor-on-a-chip response to single drug exposure.
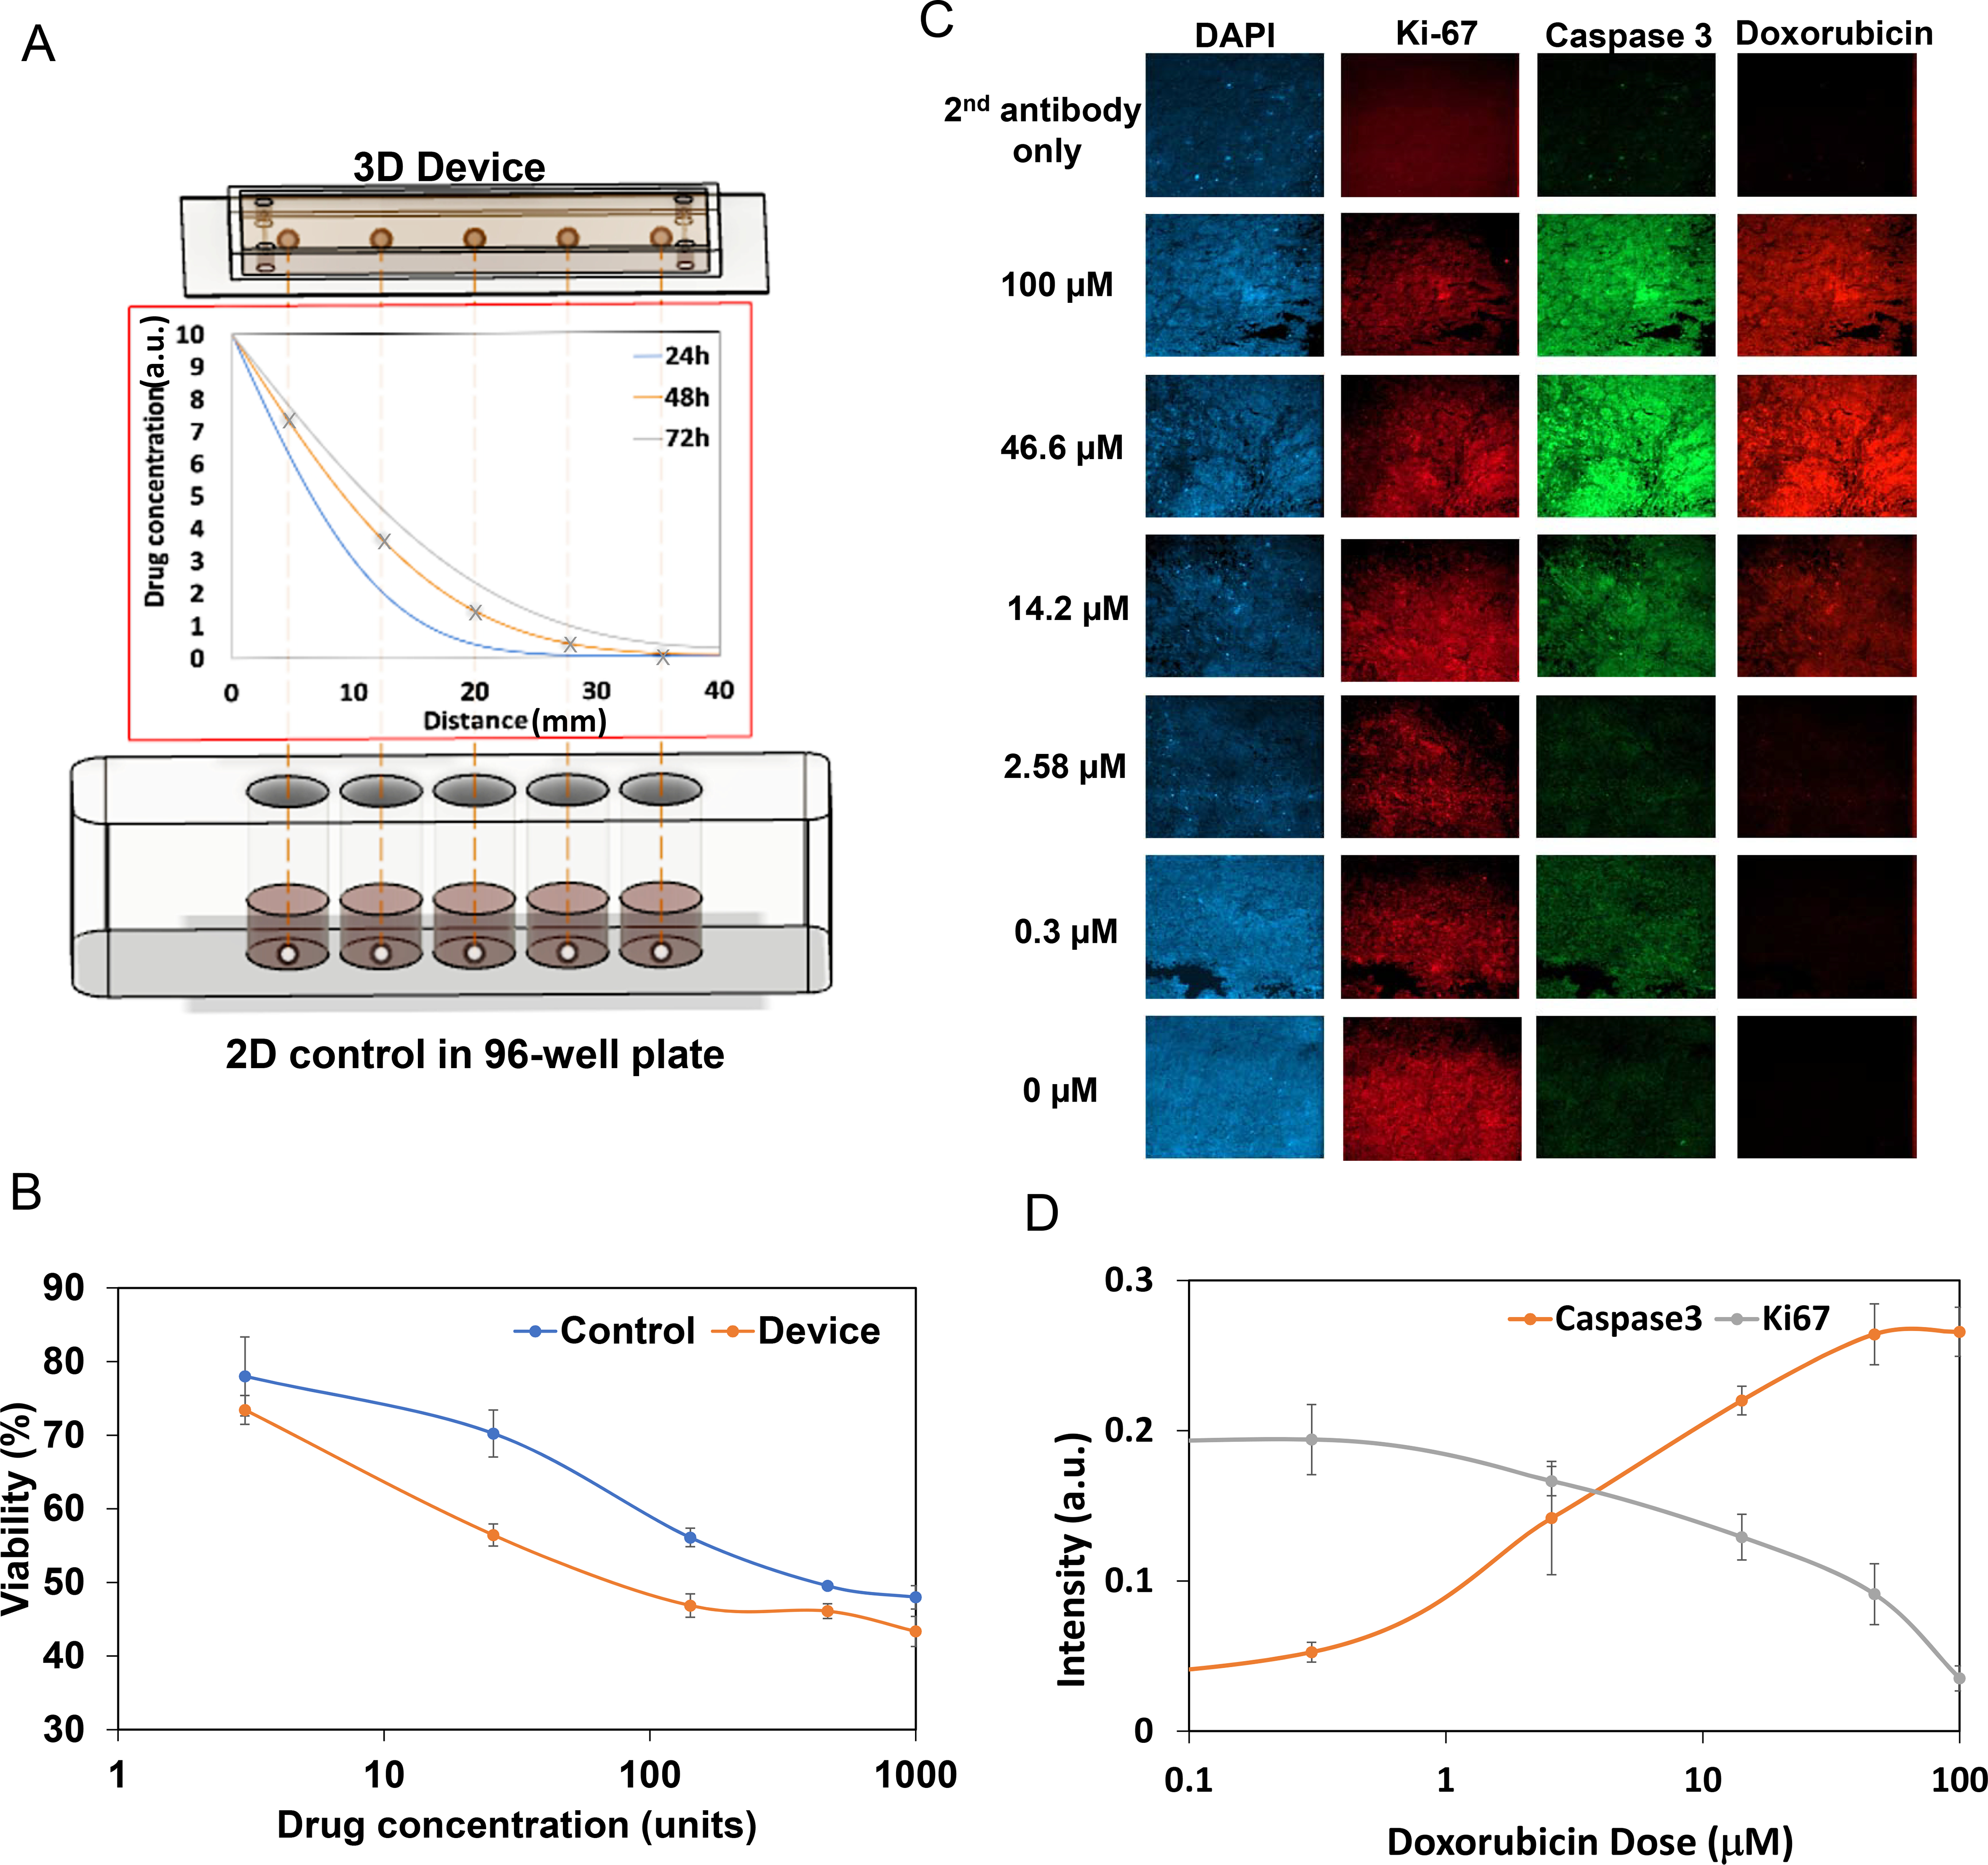
A. 3D devices vs. 2D controls setup. Top: Five tumors were inserted in series into the system. Middle: Simulation of drug diffusion profile for 24, 48, and 72 h. Bottom: In a 2D control, tumors were cultured in 96-well plates and treated directly with constant drug doses equal to the drug dose in the 3D device at 48 h. B. Doxorubicin drug screening results for the device and control. Note that both presented similar trends, yet the absolute drug effect was different. For doxorubicin, 1000 units=100 μM. Experiments were done in triplicates. C. Immunofluorescent staining for DAPI, Ki-67, and caspase 3, and autofluorescence of doxorubicin, in tumor samples treated with doxorubicin. Expression of caspase 3 increased and Ki-67 decreased with higher dosing, which agreed with the live/dead staining results. All images are 700×700μm D. Quantification of immunofluorescent staining intensity of caspase 3 and Ki-67. The lines are polynomial interpolations.