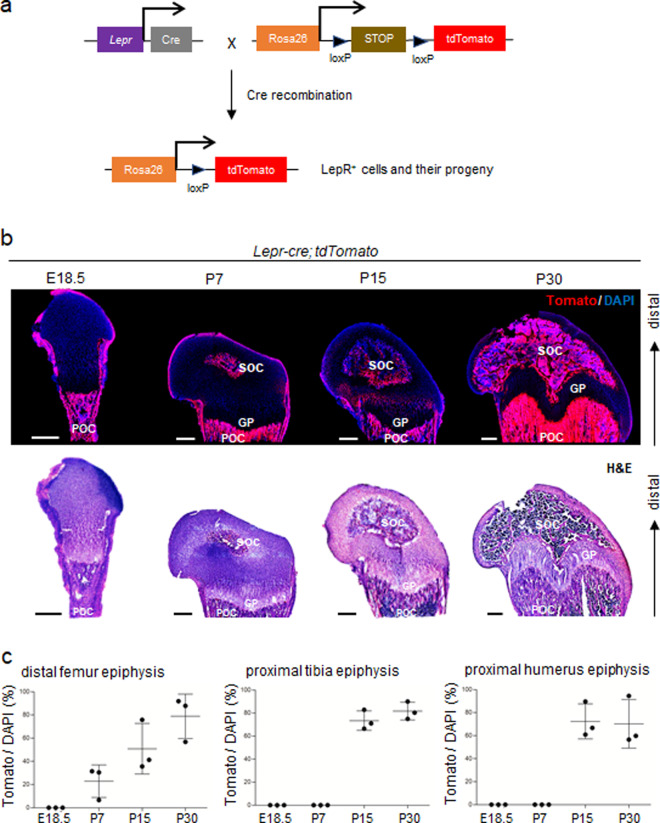
Fig. 1. Fate mapping of LepR+ MSCs during embryonic and postnatal growth.
a Illustration of in vivo lineage-tracing experiments with Lepr-cre; tdTomato mice. b The POC and SOC in the distal femur of Lepr-cre; tdTomato mice were histologically examined on E18.5, P7, P15 and P30. Representative pictures showing the appearance of Tomato+ cells at indicated stages. Tomato+ (red) and DAPI (blue). The corresponding H&E stain are right below. GP = Growth plate; POC = Primary ossification center; SOC = Secondary ossification center. c The percentages of Tomato+ cells in SOC at indicated stages and regions. Scale bar, 300 μm. n = 3 mice. Data are mean ± s.d.

