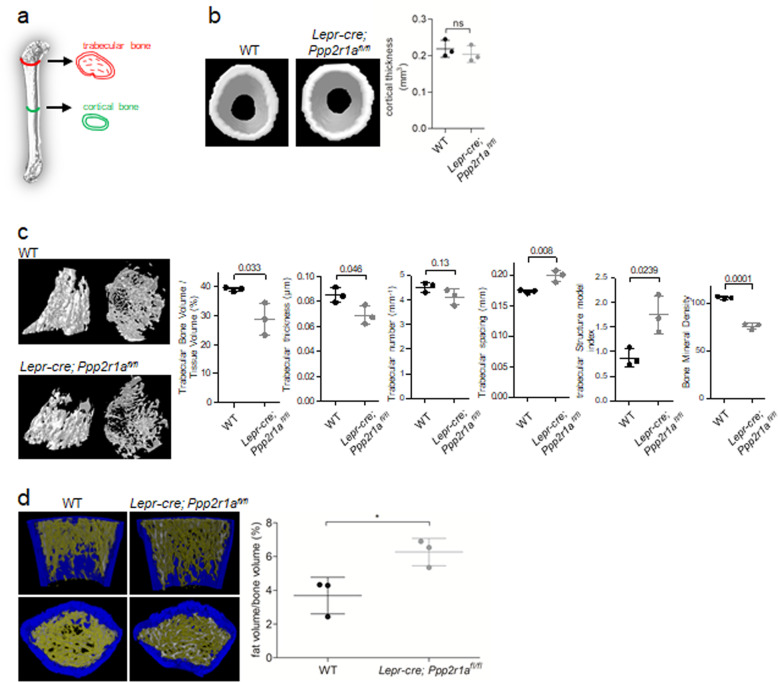
Fig. 5. The Lepr-cre; Ppp2r1afl/fl mice exhibited reduced bone density and increased fat density in trabecular bones.
Micro-CT analysis of femur in Lepr-cre; Ppp2r1a fl/fl mice and relative WT littermates at P30. a Illustration of areas scanned for cortical and trabecular bone. b left Morphological characteristics of femur cortical bone. b right There is no significant difference in cortical thickness between Lepr-cre; Ppp2r1a fl/fl mice and relative WT littermates. c left Morphological characteristics of femur trabecular bone. c right Quantification of micro-CT data on trabecular bone volume fraction (Trabecular Bone Volume / Tissue Volume, %), trabecular thickness (μm), trabecular number (mm−1), trabecular spacing (mm), trabecular structure model index, and bone mineral density (p values represent in number on top of each assessment as determined with Student’s t-test). d left Trabecular bone architecture in WT and Lepr-cre; Ppp2r1a fl/fl mice with labeling using software analysis of μCT sections (blue: cortical bone; white: trabecular bone; yellow: fat). d right Comparison of fat volume/bone volume (%) in μCT image analysis of Lepr-cre; Ppp2r1a fl/fl and relative WT littermates. n = 3 mice; Data are mean ± s.d. *p < 0.05 as determined with Student’s t-test. ns, not significant.

