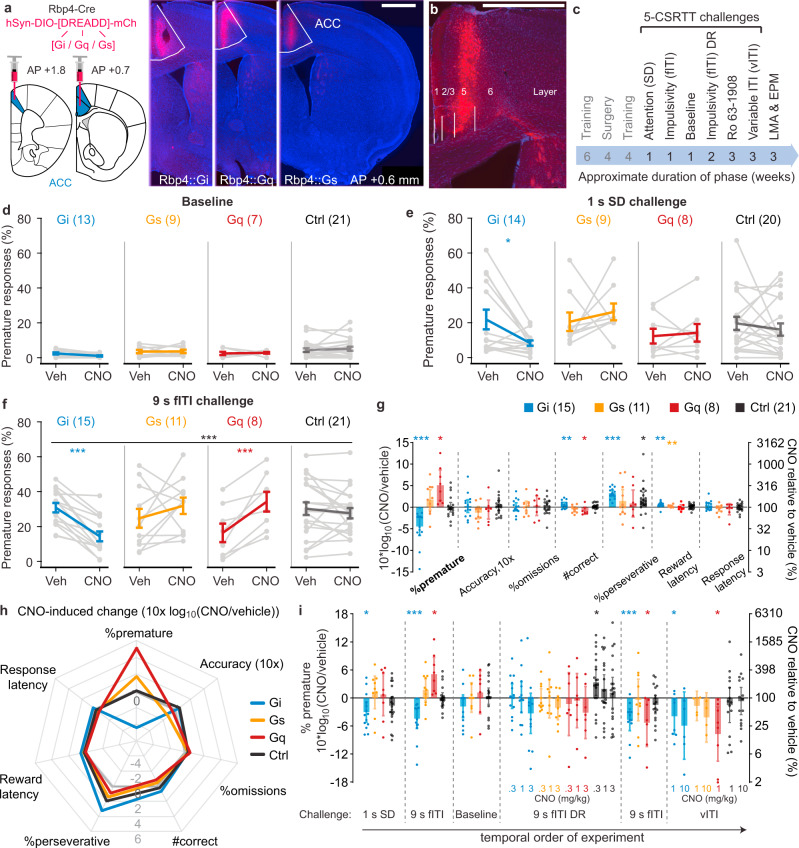
Fig. 2. Activation of the Gi-cascade in ACC L5-PCs reduces premature responding in parametric challenges of impulsivity.
a Transfection (left) and Cre-dependent expression (right) of hM4Di-mCherry (Gi), hM3Dq (Gq) and rM3Ds (Gs) in ACC L5-PCs in coronal slices collected at ~0.6 mm anterior of bregma; scale bar, 1 mm. b Laminar expression of hM4Di-mCherry (red); scale bar, 1 mm. c Temporal order of surgery and chemogenetic/behavioural testing, including the duration for each test phase; all tests except for the EPM were conducted within-subject with vehicle and CNO applications separated by 3-7 d. d–f Premature responses after injection of vehicle (Veh) or CNO for the four subgroups of the cohort [Gi (blue), Gs (orange), Gq (red), mCherry-controls (Ctrl; black), N-numbers in brackets] and 5-CSRTT challenge condition indicated above. Black stars indicate significant CNO-group interaction (RM-ANOVA); coloured stars indicate Sidak paired post-hoc test between vehicle and CNO conditions in the colour-coded group. g CNO-induced changes in the 9s fITI-challenge measured as log10-transform of the within-subject ratio (value after CNO/value after vehicle) for relevant behavioural parameters on the 5-CSRTT are shown for the 4 groups indicated in the legend with N-numbers stated in brackets. h Same data and N-numbers as in g depicting the parametric response profile of individual groups; grey line indicates 0-lattitude (no CNO-induced change). i CNO-induced changes of premature responses (as in g) shown for the different parametric challenges in order of their execution, including dose-response (DR) experiments in the fITI- and vITI-challenges as indicated. N-numbers for the first three protocols are stated in d–f, for the other three experiments N-numbers are as follows in chronological order; fITI-DR: Gi (13), Gq (7), Gs (9), Ctrl (20); repeated 9s-fITI: Gi (12), Gq (7), Gs (10), Ctrl (18); vITI: Gi (8 for 1 mg/kg, 6 for 10 mg/kg), Gq (8), Gs (4), Ctrl (15). Asterisks in g and i indicate one-sample t-tests against 0. See Supplementary Fig. 2 for related accuracy data and Supplementary Tables 3 and 7–9 for reasons for varying N-numbers across experiments, further statistical analysis, and absolute response numbers. 1 mg/kg CNO was used for the Gq-group and a subset of Ctrl mice, 10 mg/kg was used for the remainder, except for DR experiments for which doses are indicated in i. *P < 0.05; **P < 0.01; ***P ≤ 0.001; error bars, s.e.m. in d–f, otherwise C.I.; individual dots or dot-lines represent subjects.

