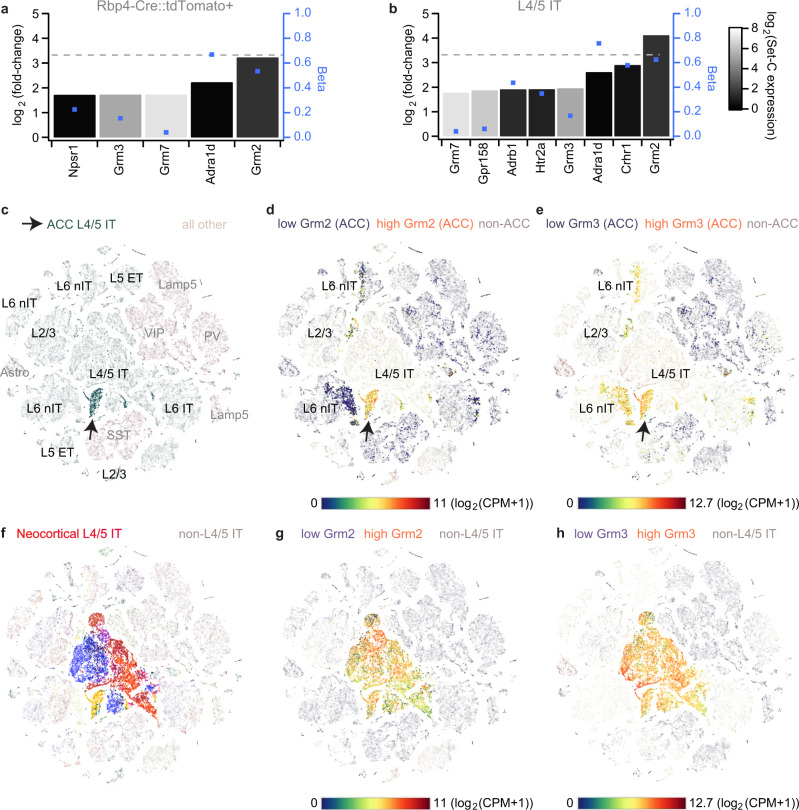
Fig. 5. Differential gene expression analysis across 402 GPCR-encoding genes within the mouse ACC.
a, b Differential gene expression values (log2-transformed ratios of gene expression in target set of ACC L5-cells relative to a non-target set of GABAergic, L2/3/6 excitatory and non-neuronal ACC cells, N = 3514; left axis), difference of share of cells with expression in target set and non-target set (Beta, blue dots, right axis), and average expression level in non-target set (log2(CPM + 1); grey scale) are displayed for all GPCR-encoding genes that are among differentially expressed transcripts in target set (Bonferroni-corrected P < 0.05) and are expressed at least threefold higher in target set compared to the non-target set. Horizontal dotted line indicates a 10fold higher expression in the target set (referring to left axis). The calculation has been performed by either selecting tdTomato-positive excitatory cells extracted from an Rbp4-Cre::Ai14 line (i.e. using the same selection as for the chemogenetic experiments in Figs. 2–4; N = 676; a), or by selecting clusters of L4/5 intertelencephalic-projecting (IT) cells according to the metadata (N = 1238; b). c t-SNE maps of cell-type clusters of the complete dataset12 involving 20 cortical regions with the cells from the ACC target (green, arrow) sets indicated; overlaid black and grey names indicate clusters of excitatory and non-excitatory cells, respectively. d, e Expression levels—colour-coded according to the continuous scale below—of Grm2 (d) and Grm3 (e) projected onto the ACC cells of the t-SNE map shown in c indicate high expression of those genes majorly in excitatory cells, with Grm2 (compared to Grm3) showing a higher specificity for L4/5 IT cells. f Same plot as (c) but for displaying L4/5-IT cells across all analysed cortical areas (shown in different colours). Expression of Grm2 (g) and Grm3 (h) across L4/5–IT cells of all analysed regions. Gene expression analysis and creation of t-SNE maps have been performed in CytosploreViewer. See Supplementary Data 2 for details of sets, results and analysed GPCR genes, and Supplementary Fig. 3 for the same analyses as in a, b) using a reduced number of cell types for the non-target set.

