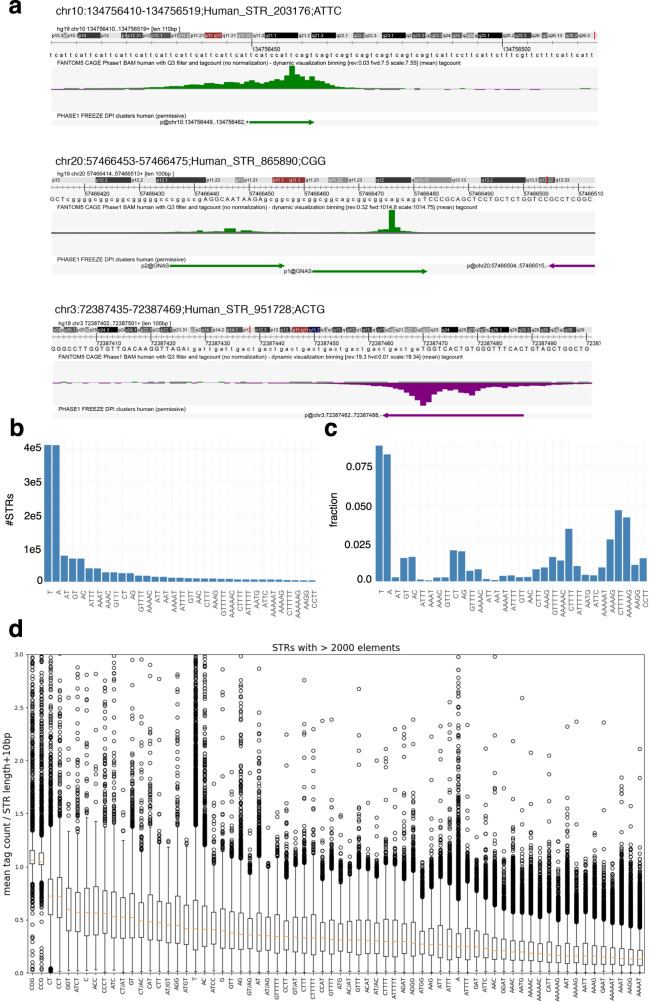
Fig. 1. CAGE peaks are detected at STRs.
a Three examples of STRs associated with a CAGE peak. The Zenbu browser79 was used. top track, hg19 genome sequence; middle track, CAGE tag count as mean across 988 libraries (BAM files with Q3 filter were used); bottom track, CAGE peaks as called in ref. 2. b Number of STRs per STR class. For sake of clarity, only STR classes with >2000 loci are shown. c Fraction of STRs associated with a CAGE peak in all STR classes considered in b. d CAGE signal at STR classes with >2000 loci. CAGE signal was computed as the mean raw tag count of each STR (tag count in STR ± 5 bp) across all 988 FANTOM5 libraries. This tag count was further normalized by the length of the window used to compute the signal (i.e., STR length + 10 bp). The orange bar corresponds to the median value. The lower and upper hinges correspond to the first and third quartiles (the 25th and 75th percentiles). The upper whisker extends from the hinge to the largest value no further than 1.5 × IQR from the hinge (where IQR is the interquartile range or distance between the first and third quartiles). The lower whisker extends from the hinge to the smallest value at most 1.5 × IQR of the hinge. Data beyond the end of the whiskers are plotted individually.

