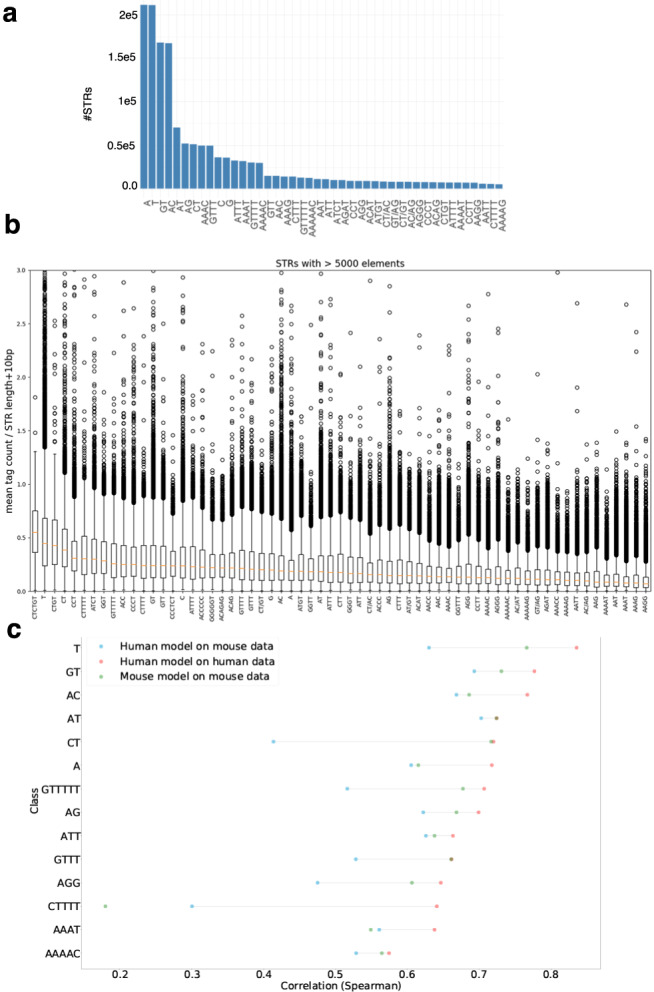
Fig. 6. STR transcription initiation in mouse.

a Number of mouse STRs per class. For sake of clarity, only STR classes with >5000 loci are shown. b CAGE signal at mouse STR classes with >5000 loci. CAGE signal was computed as in Fig. 1d. Boxplots are defined as in Fig. 1d. c Testing the accuracy of CNN models built in human and tested in mouse for different STR classes. Performances of the models are assessed by computing the Spearman ρ between (i) CAGE signal observed in mouse and signal predicted by a model learned in human (blue dots), (ii) CAGE signal observed in mouse and signal predicted by a model learned in mouse (green dots), and (iii) CAGE signal observed in human and signal predicted by a model learned in human (red dots).
