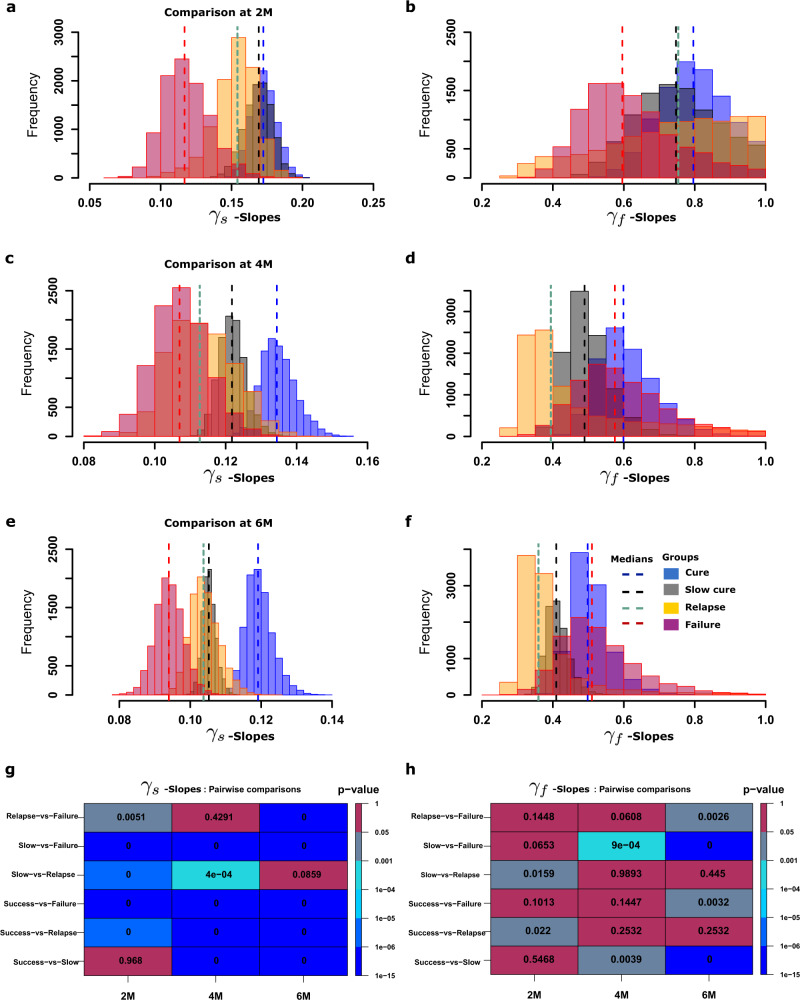
Fig. 4. Distributions of model estimated kill rates/biomarkers.
Distributions of γs - and γf -slopes based on 2-months, 4-months and 6-months accrued TTP data. a γs -slopes based on 2 months TTP data, b γf -slopes based on 4 months TTP data, and c γs -slopes based on 6 months TTP data. d The magnitude of γf -slopes at 2 months, e at 4 months, and f at the end of 6 months. g Pairwise analysis using the Mann–Whitney test for distributions of slopes based on 2, 4 and 6 months data versus each cluster (cure, slow-cure, relapse and failure) for the γs-slopes shows p-values in each cell that were significant even with 2-months of data, except with cure versus slow cure group. h Pairwise statistical difference analysis for γf, found that few p-values were significant, and even those had an inconsistent pattern.

