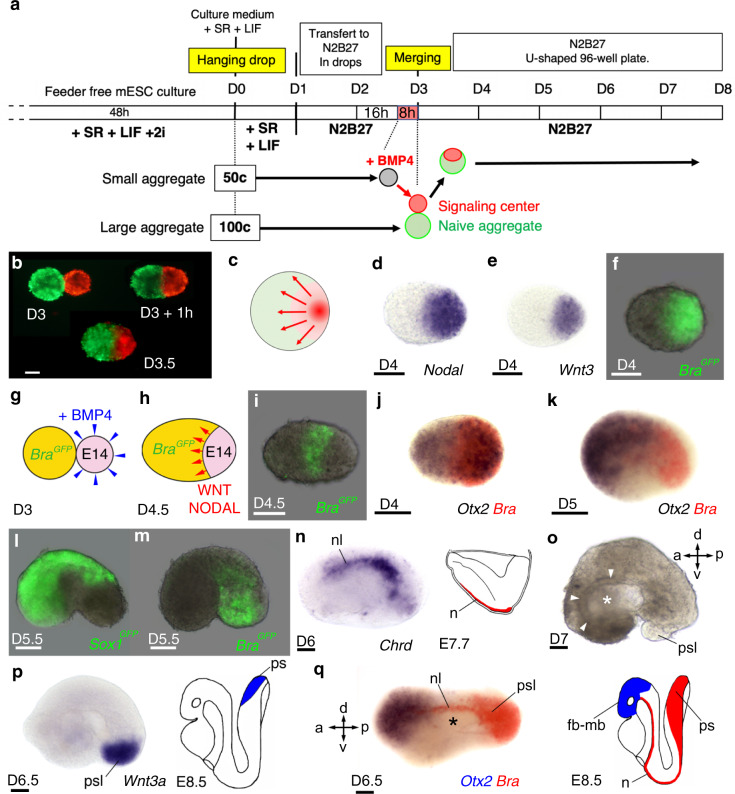
Fig. 1. Formation of embryoids by instruction of ESC aggregates with a morphogen signalling centre.
a Experimental procedure (detailed in ‘Methods’) to generate embryoids by merging a large naive (untreated) ESC aggregate with a smaller aggregate in which expression of WNT3 and NODAL morphogens were induced following incubation with BMP4 protein. b A naive ESC aggregate labelled with DiO (green) placed in contact at D3 with a BMP4 instructed ESC aggregate labelled with DiI (red) had merged within 1 h and formed a spherical embryoid after 12 h. (D3.5). c Schematic summarizing the principle of instructing an ESC aggregate with a morphogen signalling centre. d, e In situ hybridization at D4 for d Nodal and e Wnt3. f Expression at D4 of BraGFP in an embryoid made of Bra-GFP ESC. g, h Experimental design to visualize the induction of Bra expression (i) in Bra-GFP ESC (naive aggregate, yellow) in response to morphogens secreted by the signalling centre (pink) made of unlabelled E14TG2 ESC. j, k Double colour in situ hybridization for Otx2 (blue) and Bra (red). l, m Expression of Sox1GFP identifying the neurectoderm (l) and of BraGFP identifying the mesoderm (m). n Expression of Chrd (nl: notochord-like) in a D6 embryoid, right: drawing for Chrd expression in mouse embryo at E7.7. o D7 embryoid showing a large cavity (star) lined by an epithelium (arrows). p Expression at D6.5 of Wnt3a in a posterior primitive streak-like structure (psl) and in mouse at E8.5 (cartoon). q Double colour in situ hybridization showing expression of Otx2 (blue) anteriorly, of Bra (red) posteriorly and in notochord-like structure extending on top of a ventral cavity (star) in an embryoid at D6.5. Cartoon showing expression of Bra and Otx2 in the mouse embryo at E8.5 (fb-mb: forebrain-midbrain, n: notochord, ps: primitive streak). a: anterior, p: posterior, d: dorsal, v: ventral. Staging of embryoids (D: day) indicated for each panel. Numbers of performed experiments and of biological samples analysed is provided in ‘Statistics and reproducibility’ in the Methods section. Variability in genes expression is provided in Supplementary Fig. 4. Scale bars: 100 µm.

