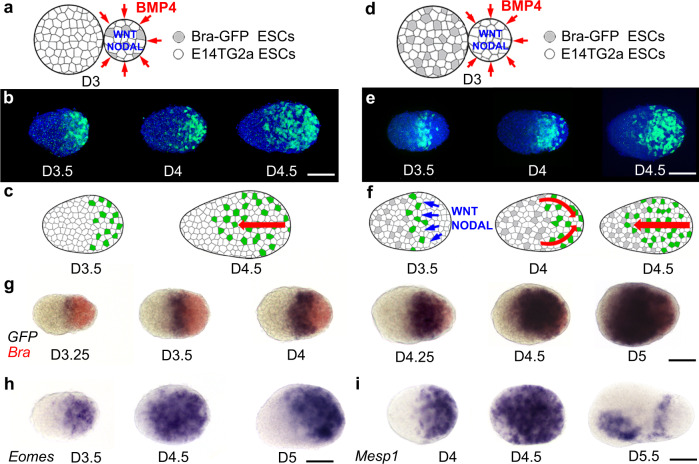
Fig. 2. Position over time of mesodermal cells during the gastrulation of embryoids.
a–c Position over time of mesodermal cells induced in the signalling centre composed of 90% of unlabelled cells and 10% of Bra-GFP ESC. a Schematic of the experiment. b Visualization of BraGFP expressing cells (green) and of cell nuclei (Hoechst—blue) in fixed embryoids (D3.5 to D4.5). c Interpretive drawing: mesodermal cells induced by WNT3 and NODAL in the signalling centre were observed progressively more anteriorly during gastrulation (red arrow). d–f Position over time of mesodermal cells induced in the naive aggregate made of 90% unlabelled cells and 10% Bra-GFP ESC by WNT3 and NODAL secreted by the signalling centre. d Schematic of the experiment. e Visualization of BraGFP (green) and of cell nuclei (Hoechst—blue) in fixed embryoids from D3.5 to D4.5. f Interpretive drawing (red arrow: change in position of BraGFP). WNT3 and NODAL secreted by unlabelled cells of the signalling centre induced expression of the BraGFP in a stripe of adjacent cells deriving from the naive aggregate. At D4, BraGFP cells were found close to the posterior end of the embryoids and at D4.5, cells were also observed in the anterior half of the embryoids. g Double colour in situ hybridization for Bra (red—all mesodermal cells) and GFP (blue—Bra-GFP mesodermal cells induced in the naive territory) from D3.25 to D5 with the same experimental design as in (d). Cells induced in the naive territory (expressing BraGFP) were observed in progressively more posterior territories (D3.25–D4.25), then from D4.5 to D5, were also observed in the anterior domain of the embryoids. h, i In situ hybridization for (h) Eomes and (i) Mesp1. h Eomes expressing cells, initially expressed posteriorly (D3.5), were then observed throughout the embryoids (D4.5), then expression disappeared in their anterior domain and was maintained in their posterior and dorsal sides (D5.0). i Mesp1 expression was initially observed posteriorly (D4) and later throughout the entire embryoids (D4.5). It then disappeared anteriorly (D5.5) except in the ventral side (likely heart field) and appeared in a stripe located in the anterior presomitic mesoderm. Embryoids oriented anterior left, dorsal up. Scale bars: 100 µm. Numbers of performed experiments and of biological samples analysed is provided in ‘Statistics and reproducibility’ in the Methods section. Variability in genes expression is provided in Supplementary Fig. 7.

