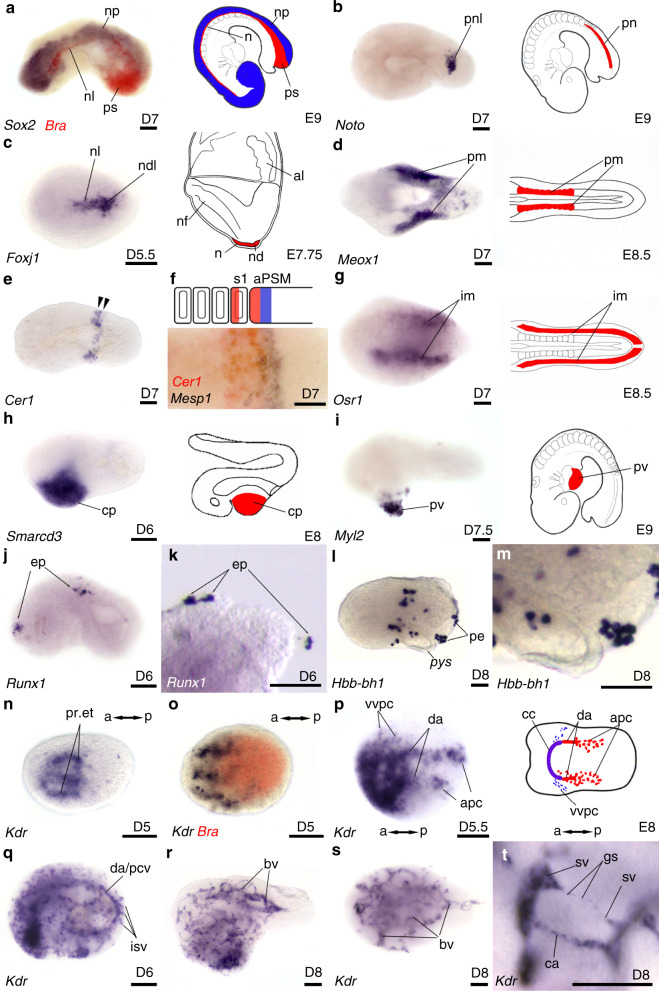
Fig. 4. Mesoderm germ layer derivatives in embryoids.
Single colour (b–e, g–t) or double colour (a, f, o) in situ hybridization revealing expression pattern for a Bra (red) in primitive streak-like (psl) and in notochord-like (nl) in contact with the neural plate (np) expressing Sox2 (blue); b Noto in posterior part of the notochord-like (pnl); c Foxj1 in nl and node-like (ndl); d Meox1 likely in paraxial mesoderm (pm), e Cer1 in newly formed somites (arrows). f High magnification of labelling with Cer1 (red) and Mesp1 (blue) in the anterior compartment of the newly formed somite (s1) and in the anterior presomitic mesoderm (aPSM) followed posteriorly by a stripe of Mesp1 expression (blue). g Osr1 expression likely in intermediate mesoderm (im). h Smarcd3 expression likely identifying cardiac progenitors (cp). i Myl2 expression in heart (pv: primitive ventricle). j, k Expression of Runx1 in likely erythroid precursors (ep). l, m Hbb-bh1 in primitive erythrocytes (pe) loosely attached at the surface of embryoids, pys: presumptive yolk sac. n Expression of Kdr in presumptive endocardiac tubes (pr. et). o Double colour in situ hybridization for Bra (red) and Kdr (blue) with anterior localization of Kdr expression at D5. p Kdr expression at D5.5 in various domains of early vascular-like development (summarized in the drawing on the right), da: dorsal aortae; apc: aorta progenitor cells; vvpc: presumptive precursors of the vitelline veins; cc: cardiac crescent. q At D6, Kdr expression observed in scattered vascular progenitors, in a large dorsal blood vessel (either da or posterior cardinal vein, pcv) and in perpendicular blood vessels that are likely to be intersomitic blood vessels (isv). r, s Network of blood vessels (bv) at D8 in lateral (r) and dorsal views (s). t High magnification of sprouting of blood vessels showing angiogenesis. ca: capillary, sv: sprouting vessel, gs: growing stem. Developmental stages of the embryoids and drawing of embryos are at the bottom right of each panel. Embryoids presented anterior to the left, in lateral view, except for d, g, p, s dorsal and n, o ventral views. Cartoons on the right in (a–i, p) show position of equivalent structures in the mouse embryo. Scale bars: 100 µm. Numbers of performed experiments and of biological samples analysed is provided in ‘Statistics and reproducibility’ in the Methods section. Variability in genes expression is provided in Supplementary Fig. 12.

