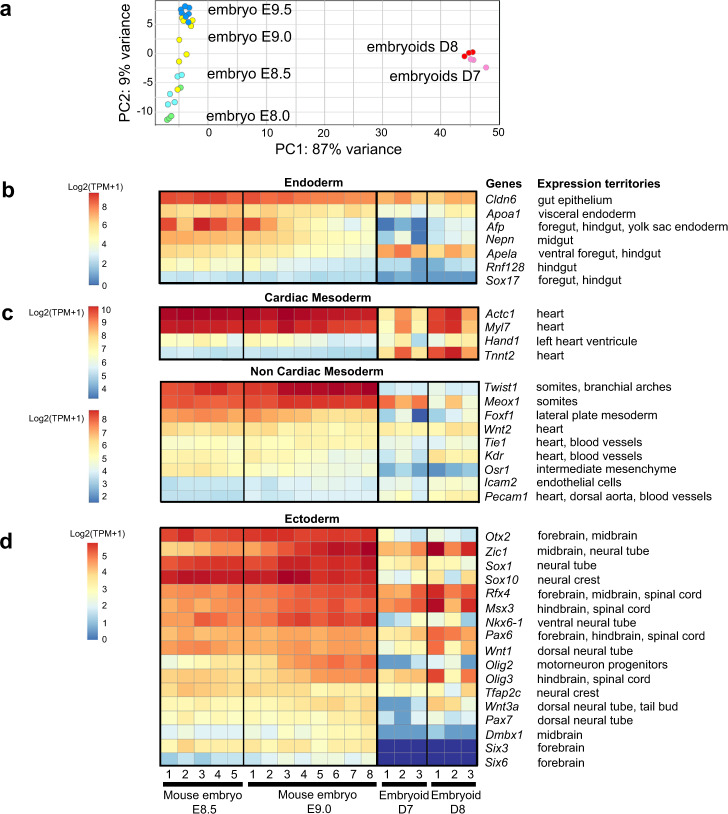
Fig. 7. Comparison of transcriptomes of D7 and D8 embryoids with of E8.5 and E9.0 mouse embryos.
a Principal component analysis (PCA) of bulk RNA-seq data from 3 replicates of 10 embryoids at D7 (pink) and D8 (red), 4 replicates of mouse embryos at E8.0, 5 replicates at E8.5, 8 replicates at E9.0 and 7 replicates at E9.5 showing that the embryoids bulk-RNA transcriptome is similar to the one for mouse embryos at E8.5 and E9.0. b–d Heatmaps of normalized expression in D7 and D8 embryoids and in E8.5 and E9.0 mouse embryos for gene markers of germ layer derivatives in the mouse embryo. b Endoderm, c Mesoderm, d Ectoderm. Because of their different levels of expressions, comparison of the expression of cardiac genes between mouse embryos and embryoids has been performed independently of the analysis for non-cardiac mesoderm. The replicates represented in these graphs were derived from biologically independent samples. For each gene, the expression territory (right) corresponds to the main expression domain of the gene in the mouse embryo between the embryonic stages TS13-TS15 (from 8.0 to 10.25 dpc) described in the Mouse Genome Informatics (MGI) Gene Expression Database (GXD) at informatics.jax.org/expression.shtml.

