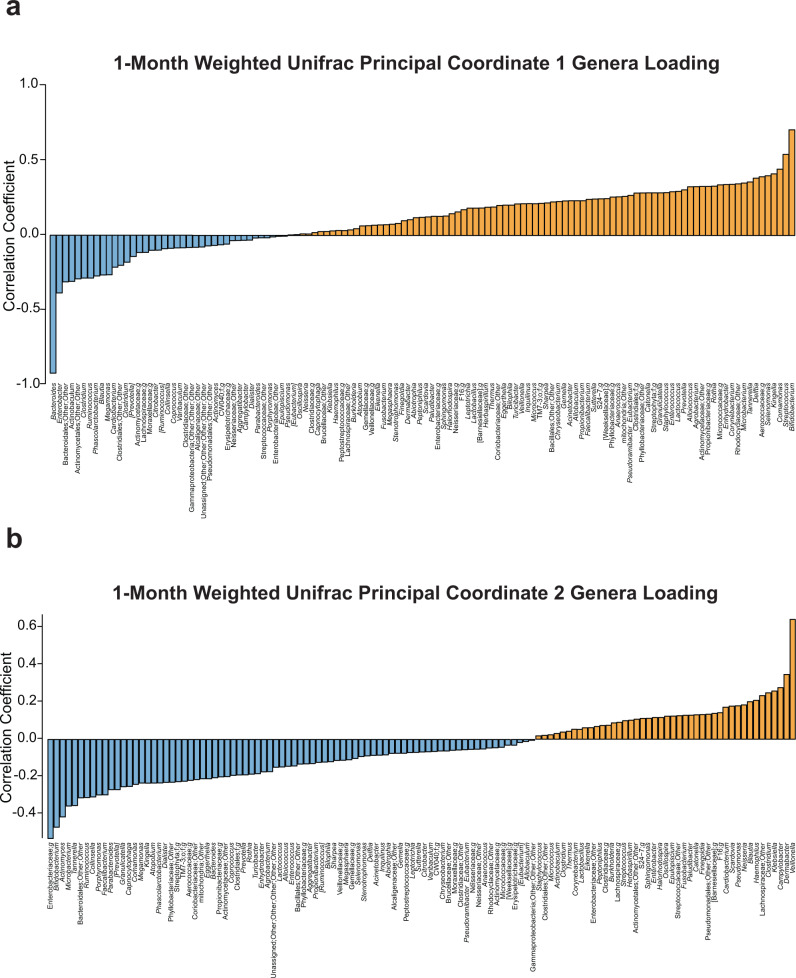
Fig. 2. Genera correlations with weighted unifrac principal coordinates at 1 month.
a Positive (orange) and negative (blue) correlations between genera and beta diversity metric, Weighted Unifrac principal coordinate 1 at 1 month of age. b Positive (orange) and negative (blue) correlations between genera and beta diversity metric, Weighted Unifrac principal coordinate 2 at 1 month of age. Source data for this figure are provided as a Source Data file.

