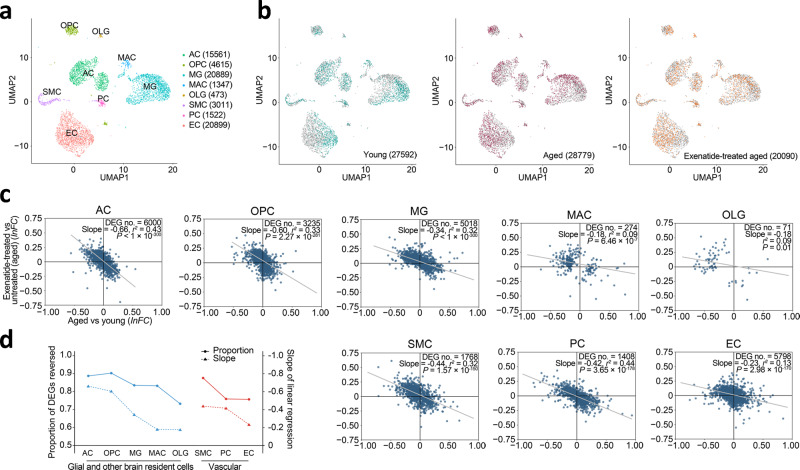
Fig. 1. Reversal of glial and neurovascular cell transcriptomic aging signatures by GLP-1RA treatment.
a UMAP visualization of the major cell type clusters identified and analysed. Numbers in brackets: cell numbers for the respective cell types. AC astrocyte, OPC oligodendrocyte precursor cell, MG microglia, MAC perivascular macrophage, OLG oligodendrocyte, SMC smooth muscle cell, PC pericyte, EC endothelial cell. b UMAP visualization of the single-cell transcriptomes from young adult, aged, and GLP-1RA (exenatide)-treated aged mouse brains. For each plot, colored dots highlight cells from the respective labeled group, while gray dots are cells from the other groups. Numbers in brackets: cell numbers for the respective groups in the dataset (n = 3 animals for each group). For clarity, 6000 cells were subsampled for visualization in each plot in a and b. c Age-related expression changes (x-axis) plotted against post-exenatide treatment expression changes (y-axis) in glial (AC, OPC, MG, and OLG), vascular (EC, PC, and SMC) cell types, and MAC. Each dot represents one differentially expressed gene (DEG). lnFC: natural log of fold change. Gray lines: lines of best fit by linear regression. d Proportions of DEGs reversed and the slopes of lines of best fit by linear regression shown in c in the different cell types. See Supplementary Data 1 for source data underlying (c).

