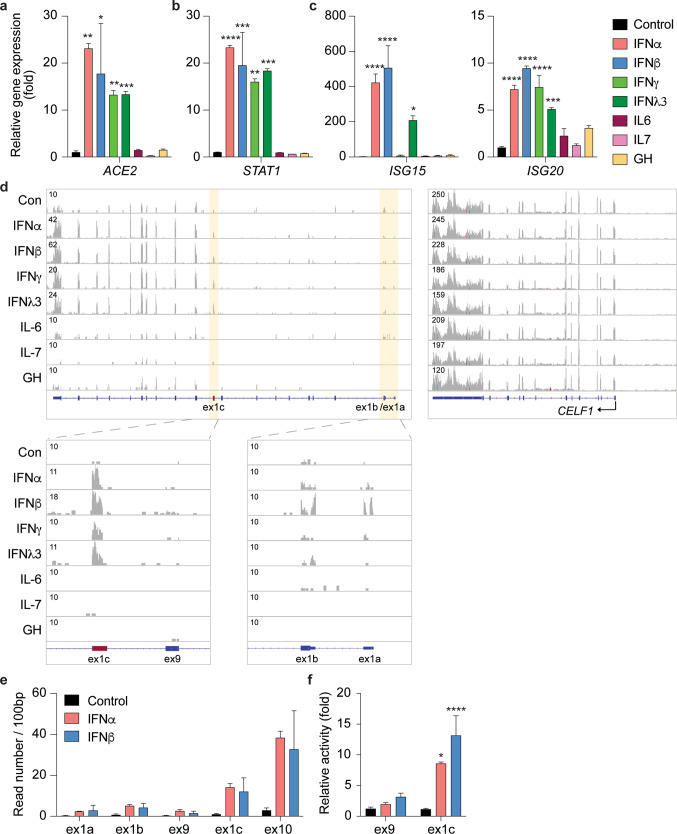
Fig. 1. Expression of ACE2 isoforms is induced by interferons.
a–c ACE2, and STAT1 and ISGs mRNA levels from control cells and cells treated with different cytokines were measured by RNA-seq. Results are shown as the means ± s.e.m. of independent biological replicates (n = 3). One-way ANOVA followed by Dunnett’s multiple comparisons test was used to evaluate the statistical significance of differences. d RNA-seq reads were matched with each exon, including the new exon (ex1c), of the ACE2 gene. The CELF1 gene served as a control for the quality of the RNA-seq data. e SAECs were cultured in the absence and presence of interferon alpha (IFNα) and beta (IFNβ) followed by RNA-seq analyses. The reads covering key exons (1a, 1b, 9, 1c and 10) are shown. f mRNA levels of exon9 and exon1c were measured using qRT-PCR and normalized to GAPDH levels. Results are shown as the means ± s.e.m. of independent biological replicates (Control and IFNβ, n = 9; IFNα, n = 3). Two-way ANOVA with followed by Tukey’s multiple comparisons test was used to evaluate the statistical significance of differences between control and cytokine-treated cells.

