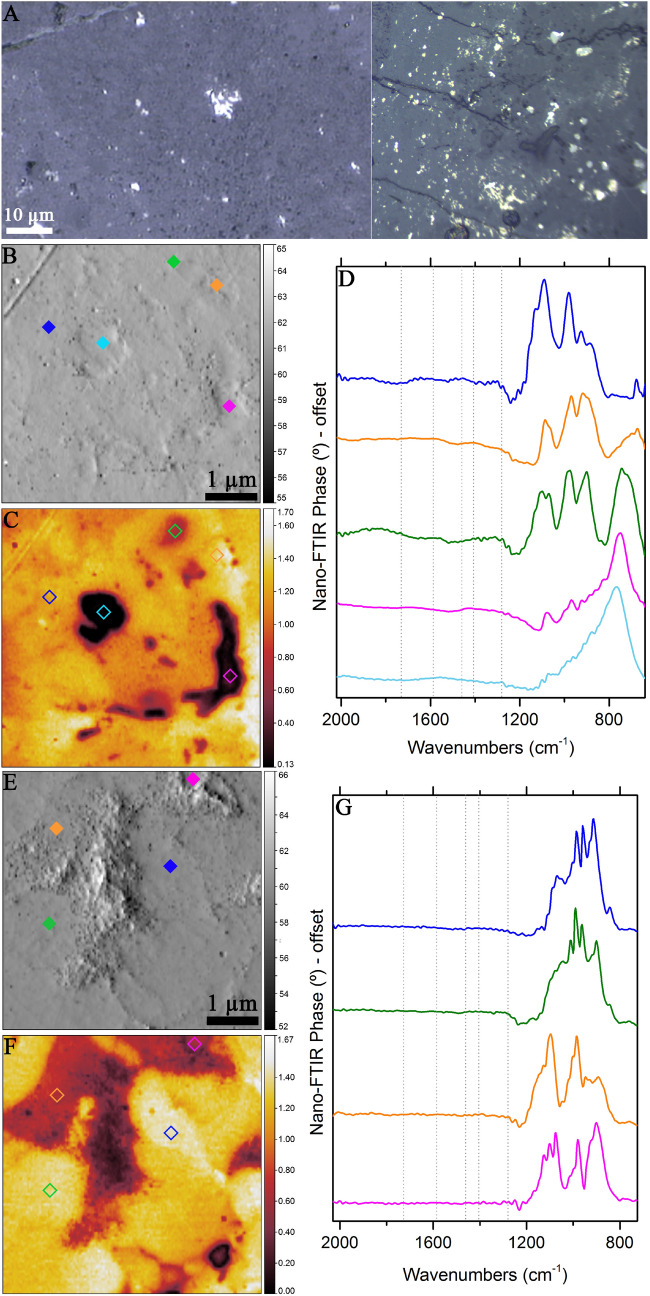
Figure 5.
Nano-FTIR spectroscopic results of QUE 97344. (A) Visible micrograph of QUE 97344. (B, E) and (C, F) show, respectively, mechanical and optical amplitude images of the two locations on QUE 93744. Diamonds denote the points from where spectra were collected. (D, G). Corresponding color-coded nano-FTIR spectra, indicating presence of silicate bands and absence of the organic bands. Dotted vertical lines indicate positions of organics observed in DOM 08006.

