

Abstract
In this study, zinc oxide nanorods, co-doped with iron and silver, were synthesized in a co-precipitation method. Its properties were determined using X-ray diffraction (XRD), Transmission electron microscopy (TEM), Field Emission Scanning Electron Microscopy (FE-SEM), Brunauer–Emmett–Teller (BET), Dynamic light scattering (DLS) and X-ray photoelectron spectroscopy (XPS) analysis. The results of FE-SEM and TEM showed that zinc oxide nanoparticles synthesized and co-doped with iron and silver were formed as separate nanorods. Also, the average values of DBP and DEHP amount of phthalates in the leachate from the landfill site of Aradkouh were obtained 52.5 and 94.69 mg/L, respectively. The highest removal efficiency in real samples for phthalates was found to be 52%. The highest removal efficiency of TOC were was 61%. The synthesized nanostructure could have proper efficiency in removal of phthalates from water sources under the visible light of LED lamp.
Keywords: Zinc oxide nanorods, Phthalates, photocatalysis, Aradkouh landfill, HPLC method
Introduction
The advent of the new chemical industry has led to the releasing of a large number of organic compounds, including industrial products, insecticides, and other chemicals in the environment. These materials usually have resistance to bio-degradation and are sustainable in nature, hence, the potential of bioaccumulation in the food chain [1, 2]. Due to the growing concern about Endocrine Disrupting Chemicals (EDCs) compounds in 1999, the Korean government has taken steps to control these harmful compounds in aquatic environments [3-5]. Phthalates are a group of organic chemicals which are commonly used in the plastics industry such as plasticizers [6, 7]. Food packaging may contain phthalates, including polyvinyl chloride (PVC) and other plastics and printing ink used on flexible food packaging [8, 5]. Many products, such as construction materials, household linen, clothes, cosmetics, medications, medical equipment, children’s toys, gloves, food packaging, automobiles, waxes, cleaning products and pesticides contain phthalates [9, 10]. One of the most widely used phthalates is Bis (2-ethylhexyl) phthalate (DEHP) which is used in the plastic industry, especially medical equipment. About 3 to 4 million tons of phthalates are produced in the world and are used in various industries [11-15]. The number of phthalates in the environment has been detected. For example, the previous studies have shown that the amount of these materials in wastewater 10–300 µg/L has been reported [16, 17]. In another study, the amount of DEHP was measured at two municipal landfill sites in Japan, with the amount of 25 µg/L was reported. The amount of DBP was also reported about 2.3 to 12 µg/L [18]. In another study, which was conducted in Europe in 11 landfill sites in 2003, the highest amount of organic compound related to DEHP was reported. The average of this pollutant was determined to be 122 µg/L [19]. In 2002, to measure the number of phthalates, a study was carried out on 160 drinking water samples, 35 samples of river sediments and water supply channels, 39 samples of sewage outlet and 38 samples of sludge in a treatment plant in Germany. The average of DEHP in surface waters, at sewage outlet, in river sediments, and in the sludge of the sewage treatment plant were 0.33 to 97.8 µg/L, 74.1 to 182 µg/L, 0.21 to 8.44 mg/kg, and 27.9 to 154 mg/g per one gram of dry sludge, respectively [20]. The adverse effects of exposure to phthalates have been proven in many studies. Malignant effects on the liver, kidney, thyroid, testicular tissue are the most important effects of exposure to these materials [21-23]. There are various methods for removing phthalates from aqueous solutions, including biological methods, extraction, wet oxidation, activated carbon adsorption and chemical oxidation. Furthermore, there are membrane processes such as reverse osmosis (RO) and electro dialysis (ED) which are considered very costly. The limitations and deficiencies of these processes and operations can be improved by the using of alternative technologies. Meanwhile, advanced oxidation processes (AOPs) have attracted the attention of researchers [24-27]. The biological decomposition of phthalates in the environment is time-consuming and has a half-life of 27–70 days [28]. The wide energy gap of Zinc Oxide (ZnO) can only absorb ultraviolet light (UV) at or below 385 nm, and visible light with a wavelength of between 400 and 700 nm account for 45% of the total solar radiation energy, while UV radiation contains less than 10% of it [29]. Therefore, the photocatalytic activity of ZnO requires greater efficiency for usage in a broad range. It has been demonstrated that modification of semiconductors, including doping with transition metals or rare earth, can improve their properties. Photocatalytic properties of ZnO greatly improve when doped with metal ions. The presence of transition metals on the semiconductor surface can increase the efficiency of electron capturing from the conduction band. Doped metal ions in ZnO nanostructures can be lead to improvement of fluorescence property and concentration controlling of surface defects. Doping of ions such as copper and silver has had a good performance [30]. In this work, we have investigated the synthesis of Fe and Ag co-doped ZnO nanostructures using a simple and inexpensive chemical co-precipitation route. The optimization of DEHP and DBP degradation were performed under visible LED irradiation by HPLC method.
Experimental
Study location
Aradkouh Waste Processing Complex (AWPC) is located at the 23rd km of old Tehran-Qom road and south of Kahrizak city. On average, a daily rate of 8000 tons of various wastes from different sources of production, such as 22 districts of Tehran, surrounding towns and cities, health centers and treatment centers are sent to the center for disposal. The quantity of waste entering the complex is initially recorded in the central weighing system and, depending on the quality and quantity and sources of waste generation are sent to the processing units or the existing dumping center.
Catalyst preparation
To the synthesis of ZnO nanoparticles, we used the cheap, simple, and available co-precipitation method. Firstly, 5.94 g Zn (NO3)2. 6H2O along with a certain amount of silver nitrate iron chloride was added to 50 mL distilled water. Ammonia solution (25%) was used to bring the pH to about 10.5. After that, the sample was refluxed at 100 °C for 1 hour (h). To provide uniform temperature, the balloon was placed inside a burned oil container on heater (during that time the solution was uniform with the magnet). When the reflux process was completed, the sample was cooled down in room temperature until the sediment was built. After completion of the synthesis, the sample was centrifuged at 7000 rpm for 20 minutes (min). The obtained precipitate which had a creamy color washed with distilled water. Finally, the obtained precipitate was dried in an oven at 100 °C for 12 h. Also, the calcination process was carried out at 450 °C [31-33].
Catalyst characterization
To study the synthesized nanopowder properties, first, its XRD spectrum was determined in order to estimate the approximate size of nanoparticles from the analysis of this spectrum. By analyzing the peaks obtained from the spectrum, the approximate size of the nanopowder and the overall structure of the powder can be obtained. Given the peaks obtained from the XRD spectrum, the structure and phase of the formed ZnO spectrum can be compared. In this study, the PANalytical’s X’Pert HighScore 2018 software was used to interpret the XRD spectra. One method for analyzing nanoparticles is the Dynamic Dispersion (DLS) method, which has the ability to measure particles in the solution quickly, easily, and without the need for sample preparation. To determine the particle size and the average distribution of synthesized particles in terms of volume and intensity, DLS analysis was used. This analysis was carried out at the Laboratory Service Center of Sharif University of Technology and with the DLS Particle Size Measurement System of England Malvern Company, model Nano S (red badge-632.8 nm). To detect the doped elements on synthesized ZnO nanoparticles, XPS analysis carried out and colorful map elements were provided. X-ray Photovoltaic (XPS) spectroscopy is a method for analyzing the surface of the material from the point of view of elemental analysis, chemical compound and determination of bond state. In this research, samples were taken using the JEOL machine and at the center of growth of Shahid Beheshti University, a central laboratory.
The study and selection of a proper method for sample clean up
In this research, the method of solid-phase extraction and clean-up was evaluated for the extraction and preparation of real leachate samples as follows. The used column for solid-phase extraction was a CHROMABOND® C18, 3 mL, purchased from the MACHERY-NAGEL company in Germany. Furthermore, the percentage of cartridge recovery was determined at this stage [34, 35]. The leachate samples were centrifuged before being extracted for uniformity and were passed through a Watten filter of 0.45µm. The sample extracting was done in the following way: Cartridge was washed twice with 2cc methanol. The extraction column was then washed with distilled water. A certain amount of the sample passed through the filter. Washing process continued with HPLC-grade distilled water. For 5 min, the filter was vacuum-packed to be dried. Finally, the intended column was washed with 1 mL of ethyl acetate. From the remaining sample under the extraction column, 50 µL was taken and injected into the HPLC device.
Phthalate decomposition
In order to study the efficiency of Fe-Ag/ZnO nanorods on the phthalate decomposition from the actual leachate samples, the actual samples collected from the effluent of leachate treatment plant of Aradkouh were passed through the filter. Without changing at initial condition, the samples were treated by the photocatalytic process under optimum conditions of nano-catalysts concentration and 120 min as reaction time. Before and after filtration, the number of phthalates was determined. The removal efficiency of phthalates was determined and compared with pilot laboratory results [36, 37]. The specification of the test sample wastewater is described in Table 1. The organic load of samples was measured using a TC/TN analyzaer (Analytik Jena Multi N/C 2100 TOC analyzer, Analytik Jena, Jena, Germany).
Table 1.
Specification of wastewater from leachate treatment plant of a landfill site in Aradkouh site
| Parameters | Unit | Average ± SD |
|---|---|---|
| pH | - | 8.05 ± 0.5 |
| EC | mS/cm | 34.50 ± 5 |
| COD | mg/l | 35,000 ± 1500 |
| BOD5 | mg/l | 350 ± 20 |
| TOC | mg/l | 647 ± 50 |
To the measurement of two different types of phthalates, an American DIONEX HPLC device with a reversed-phase column C18 OCD with the size of 5 × 4 × 250 and a UV-Vis detector at 230 nm wavelength was used. Mobile phases for phthalate measurement were acetonitrile (90%) and HPLC-grade methanol (10%), flowing at a rate of 0.8 ml/min [38] (Scheme 1).
Scheme 1.
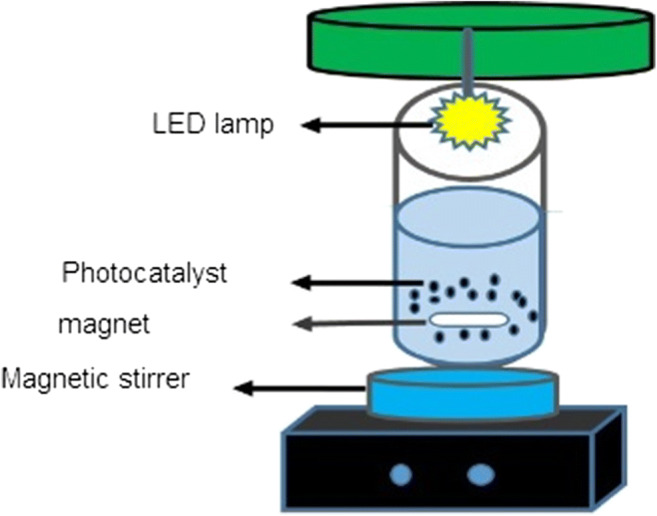
The schematic of the reactor used to remove phthalates
Results and discussion
Catalyst characterization
UV analysis
With respect to the obtained results of the UV spectrum, Eq. 1 can be used to determine the absorption coefficient and damping coefficient. Also, to calculate the energy gap of the particle, the Eq. 1 can be used (Akbari-Adergani et al. [38]. In this equation, is the absorption coefficient of the sample and is the input energy. and are a constant, the energy of the gap, respectively. Now, if we calculate and plot the curve according to it, in the case where the slope of curve is the linear, we extend the slope. In this case, where becomes zero, it can be written:
| 1 |
In this study, a reactor used is in the form of a cylinder with the characteristics inserted in Table 1. A LED lamp with above-mentioned properties was being installed in the central part. The mixing of this reactor was carried out using a magnetic stirrer (Fig. 1).
Table 2.
Characteristics of the reactor used in the photocatalytic process
| Quality | Pyrex |
|---|---|
| Shape | Cylindrical |
| Diameter (cm) | 15 |
| Total Height (cm) | 30 |
| Effective Height (cm) | 10 |
| Net Capacity (L) | 1.5 |
Fig. 1.

UV curve of modified ZnO
The appearance of a sharp band at 450 cm− 1, which is a characteristic absorption band for the ZnO-stretching vibration, confirms the synthesis of ZnO (Fig. 2). Additionally, the XRD results confirmed the presence of ZnO. According to the figure, there is wide absorption (3450 cm− 1) related to the hydroxyl groups of water molecules (O-H) with hydrogen bonds attached to the surface of zinc oxide nanoparticles.
Fig. 2.

XRD Spectrum peaks for synthesized nano- Fe-Ag / ZnO at different diffraction angles and comparing it with XRD spectrum for pure ZnO
XRD analysis
To investigate the characteristics of the prepared nanorods, first, the XRD patterns were determined. The XRD patterns of the as-synthesized nanoparticles are shown in Fig. 2. By analyzing the obtained peaks, it can evaluate the approximate size of the nanoparticles and the crystal structure of the powders. By the XRD pattern, we aim to obtain the approximate size of the nanoparticles. To calculate it, one is required to obtain the peaks’ angles and widths at half maximum of the peaks.
To compare the obtained pattern with the reference pattern, the X-pert software and its library were used. The results indicated that the position of all diffraction peaks matches about 93% with those of hexagonal ZnO peaks (with standard card JCPDS No. 36-1451). Considering the given relationship, and after calculating the particles size based on each peak, the value of D is as the last column. The average particle size is approximately equal to 19 nm. In the next step, to specify the characteristics of the as-synthesized sample is to prove the doping of iron and silver on the synthesized nanostructure. A mapping Test was used to prove the doping of iron and silver on the surface of ZnO nanostructure. Figure 3a presents the EDAX analysis of synthesized Fe-Ag/ZnO nanorods. The results have confirmed the presence of iron and silver in the as-prepared structure. The Fig. 3b shows the mapping analysis of Fe-Ag/ZnO nanorods. As shown in Fig. 3b, mapping images show that there are iron and silver elements in the structure of the synthesized material. The amounts are determined by the EDAX and XPS analysis. EDAX analyses were used to prove the doping and the presence of iron and silver in the synthesized nanostructure (Fig. 4).
Fig. 3.

EDAX and Mapping Analysis for nano-Fe-Ag / ZnO
Fig. 4.

EDAX and DLS Analysis for nano-Fe-Ag / ZnO
FESEM analysis
To investigate the apparent structure and the size of the synthesized Fe-Ag/ZnO nanorods, the FESEM analysis was used. As shown in Fig. 5a, the Fe-Ag/ZnO nanorods are properly separated from each other. Their appearance is completely stretched and in the form of a rod. The diameter and length of the nanorods are in the range of 20–60 nm and 200 nm, respectively. The high-resolution transmission electron microscopy (HRTEM) images of Fe/Ag-doped ZnO nanostructures are shown in Fig. 5b. The image of TEM analysis is proved above results. A broad scan survey spectrum is provided to identify the elements in the modified ZnO. As shown in Fig. 6b, there are some light points on surface of compound. They are Ag nanoparticles which are dispersed on catalyst surface. On the other side, there are some dark points, too. These points are agglomerated Fe nanoparticles. The agglomeration was happened because of their magnetic property.
Fig. 5.

a FESEM image of synthesized Ag, Fe-doped ZnO nanorods by co-precipitation synthesis method. bTEM images of Ag, Fe-doped ZnO nanoparticles
Fig. 6.

XPS analysis of Fe-Ag/ZnO the nanorods
XPS analysis
The average size of the nanorods in suspended ethanol was estimated using by XPS analysis.A typical wide scan spectrum of modified ZnO nanorods indicates in Fig. 6. The main elements of photoelectron peaks, Zn, O and C, Fe and Ag were obtained. Some small peaks, which were nearly 8.4 eV lower than each main photoelectron peak, were observed. The minor peaks along with each main peak are X-ray satellites that are associated with Fe 2p and Ag 3d radiation.
It can be seen in Fig. 7 that the asymmetric O 1 s peak in the surface of the sample was fitted by three nearly Gaussian components, centered at 530.2 eV(1 s), 531.4 eV(1 s A) and 532.6 eV(1 s B), respectively. The three fitted binding energy peaks approximate the results of Y. C. Chen and et al. [39].
Fig. 7.

Oxygen 1 s spectra of ZnO
BET analysis
Figure 8 indicates the N2 adsorption-desorption isotherm and pore distribution curves of Ag, Fe-doped ZnO. The sample shows a type II adsorption isotherm with an obvious lagging loop, indicating that the capillary cohesion and evaporation occurred at different pressures, which is determined by the thermodynamic equilibrium of adsorption and desorption processes and the shape of the channel. In the inset of Fig. 9, the pore size distribution curve of Barrette-Joynere-Halenda (BJH) model is shown, in which the pore diameter of Fe-Ag/ZnO mainly distributes about 2 nm. The results indicate that the specific surface area the mean pore diameter, and the total pore volume of Ag, Fe-doped ZnO were 19 m2/g, 31 nm and is 0.1402 cm3/g, respectively.
Fig. 8.

N2 adsorption-desorption isotherm and (in inset) pore distribution curve of Fe-Ag/ZnO nanorods
Fig. 9.

The concentration of DEHP and DBP, before and after placing into the designed reactor
Phthalate decomposition in real sample
The amount of DBP and DEHP phthalates in the effluent of the treatment plant of leachate from the solid waste landfill site of Aradkouh was determined by sampling at two times and the extraction was done through solid-phase extraction. As shown in Fig. 9, the concentration of DBP and DEHP was reported 52.5 mg/L and 94.69 mg/L, respectively. Then, the actual samples entered the reactor. The highest removal efficiency of phthalates was found to be 52% in actual samples. Also, TOC amount and the degree of destruction of actual leachate have been shown in Fig. 10. After transfer into the designed reactor, the amount of mineralization was calculated. The average of TOC in the current of the treatment plant of leachate from the solid waste landfill site of Aradkouh and the average of removal efficiency of TOC were found to be 647 mg/L and 61%, respectively. In Tehran Aradkouh leachate treatment plant, after the arrival of the leachate into an anaerobic division pond and during the necessary detention time, three types of chemicals (sodium bicarbonate, urea, disodium phosphate hydrogen) are injected. Western anaerobic reservoir plays a major role in the biological treatment process as the first stage of the process. After the completion of the biological treatment, lime is injected as a pH balancer. After the injection of lime, Ferric chloride is injected as a coagulant entered into the settling pond after the formation of sediment. In this step, the sludge is separated from wastewater; the sludge is directed to the settling ponds, the wastewater is directed to the aerobic reservoir. Afterwards, wastewater aeration is done as soon as it is entered the reservoir. Aeration is carried out through the blowers in the air injection room and through the diffusers mounted on the reservoir floor, aeration is carried out. In the end, for the disinfection process, chlorination and ozonation treatment are carried out. In order to determine the amount of DBP and DEHP phthalates in the wastewater of the treatment plant of leachate from the solid waste landfill site of Aradkouh, sampling was carried out at two times and the extraction was done through solid-phase extraction. In six measured samples, on average, the amount of DBP and DEHP was reported 5,52 mg/L and 69,96 mg/L, respectively.
Fig. 10.
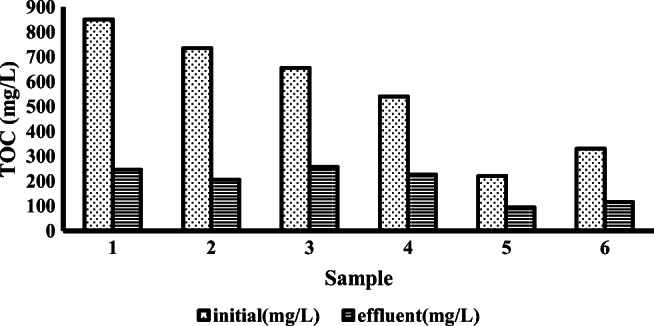
The amount of TOC, before and after placing into the designed reactor
High amounts of phthalate in refined leachate from the treatment plant indicate high consumption of plastics, medical supplies, disposables, food packaging and toys in the municipal wastes of Tehran (Bauer and Herrmann [40]. On the other hand, high concentration in the treatment plants output reflects the inefficiency of the treatment plants in the refinement of resistant organic pollutants such as phthalates. In a study on the number of phthalates in the water of rivers and sewage of industries in Taiwan by Mailho et al., the concentration of phthalates in river water and sewage from 10 to 300 µg, and in the outlet of the refinery of plastic manufacturing plants, 30 mg/L were reported (Mailhot et al. [16]. In this study, the amount of DEHP in the sludge obtained from the river bed, 0.2–0.8/4 µg/g and in the sludge obtained from the wastewater treatment plant of the industries 28–154 mg/g was reported. In another study, by Hiroshi Asakura et al. in 2004, the amount of DEHP was measured at two municipal landfill sites in Japan, with the amount of 25 µg/L and 19 µg/L was reported, respectively for both sites. Among the studied phthalates, DEHP was the highest. Moreover, the amount of DBP was reported to be 2.3 to 12 µg/L (Asakura et al. [18]. In this study, the age of leachate was also studied and the results of the study showed that DEHP concentration does not correlate with the age of the landfill site; this is due to their hydrophobicity, log POW = 3.98, and could remain in leachate for years. Other similar studies were done on the possibility of treatment of phthalates by conventional methods. The results showed that coagulation processes, aeration, sedimentation and biological treatment do not have much efficiency on the removal of phthalates (Chaudhary et al. [3]. In another study by Sanna K. Marttinen et al., which was conducted in 2003, 11 landfill sites in Europe were investigated. The highest amount of organic compound reported was related to DEHP. The average of this pollutant was determined to be 122 µg/L (Marttinen et al. [19]. Hermann Fromme et al. in 2002, investigated160 samples of water, 35 samples of river sediment and water supply channel, 39 samples of sewage outlet and 38 samples of sludge in a refinery in Germany. In that work, the concentration of phthalates was evaluated. The average of DEHP per one gram dry sludge in surface waters ranged from 0.33 sludge of sewage treatment plants 27.9 to 154 mg/g, in sewage outlet from 74.1 to 182 µg/L, in riverside sediments, 0.21 to 8.44 mg/kg (Hermann Fromme et al. [20].
Conclusions
In this study, Fe-Ag/ZnO nanorods were synthesized by the simple and inexpensive route of co-precipitation; and structural modification was performed to reduce the band gap and improve the structure of zinc oxide. The results of FE-SEM and TEM show that the synthesized ZnO nanorods and doped with iron and silver have been formed as long and separate rods. The XRD analysis and the results obtained from the X-PERT software show that Zinc Oxide nanoparticles have been well-formed. In examining the number of phthalates in the wastewater from the treatment of leachates from the Aradkouh landfill site, on average, the concentration of DBP and DEHP was reported 52.59 and 94.69 mg/L, respectively. The highest removal efficiency of phthalates in real samples was found to be 52%. The results of the study are indicated that of Fe-Ag/ZnO nanoparticles were synthesized by an appropriate method. The formed structure is similar to standard nanostructures and can also have optimal efficiency in eliminating phthalates from water sources under visible light radiation.
Footnotes
Publisher’s note
Springer Nature remains neutral with regard to jurisdictional claims in published maps and institutional affiliations.
Contributor Information
Akbar Eslami, Email: akbar_eslami@yahoo.com.
Mohammad Hossien Saghi, Email: saghi9@gmail.com.
Behrouz Akbari-adergani, Email: analystchemist@yahoo.com.
Shahram Sadeghi, Email: shahram.snna@yahoo.com.
Mansour Ghaderpoori, Email: mghaderpoori@gmail.com.
Mahboubeh Rabbani, Email: m_rabani@iust.ac.ir.
Abdolazim Alinejad, Email: azimalinejad@gmail.com.
References
- 1.Ahmadi E, Yousefzadeh S, Ansari M, Ghaffari HR, Azari A, Miri M, et al. Performance, kinetic, and biodegradation pathway evaluation of anaerobic fixed film fixed bed reactor in removing phthalic acid esters from wastewater. Sci Rep. 2017;7:41020. doi: 10.1038/srep41020. [DOI] [PMC free article] [PubMed] [Google Scholar]
- 2.Jonidi-Jafari A, Gholami M, Farzadkia M, Esrafili A, Shirzad-Siboni M. Application of ni-doped zno nanorods for degradation of diazinon: Kinetics and by-products. Sep Sci Technol. 2017;52:2395–406. doi: 10.1080/01496395.2017.1303508. [DOI] [Google Scholar]
- 3.Chaudhary BI, Nguyen BD, Smith P, Sunday N, Luong M, Zamanskiy A. Bis (2-ethylhexyl) succinate in mixtures with epoxidized soybean oil as bio‐based plasticizers for poly (vinylchloride) Polym Eng Sci. 2015;55:634–40. doi: 10.1002/pen.23934. [DOI] [Google Scholar]
- 4.Kamarehie B, Tizabi SMS, Heydari R, Jafari A, Ghaderpoori M, Karami MA, et al. Data on the bisphenol a adsorption from aqueous solutions on pac and mgo ~ pac crystals. Data Brief. 2018;21:746–52. doi: 10.1016/j.dib.2018.10.033. [DOI] [PMC free article] [PubMed] [Google Scholar]
- 5.Koch HM, Bolt HM, Angerer J. Di (2-ethylhexyl) phthalate (dehp) metabolites in human urine and serum after a single oral dose of deuterium-labelled dehp. Arch Toxicol. 2004;78:123–30. doi: 10.1007/s00204-003-0522-3. [DOI] [PubMed] [Google Scholar]
- 6.Hauser R, Duty S, Godfrey-Bailey L, Calafat AM. Medications as a source of human exposure to phthalates. Environ Health Perspect. 2004;112:751–3. doi: 10.1289/ehp.6804. [DOI] [PMC free article] [PubMed] [Google Scholar]
- 7.Latini G. Monitoring phthalate exposure in humans. Clin Chim Acta. 2005;361:20–9. doi: 10.1016/j.cccn.2005.05.003. [DOI] [PubMed] [Google Scholar]
- 8.Azadbakht F, Esrafili A, Yeganeh Badi M, Sajedifar J, Amiri M, Gholami M. Efficiency of persulfate-based advanced oxidation process (uv/na2s2o8) in removal of metronidazole from aqueous solutions. J Mazandaran Univ Med Sci. 2017;27:119–29. [Google Scholar]
- 9.Badi MY, Esrafili A, Pasalari H, Kalantary RR, Ahmadi E, Gholami M, et al. Degradation of dimethyl phthalate using persulfate activated by uv and ferrous ions: Optimizing operational parameters mechanism and pathway. Journal of Environmental Health Science Engineering. 2019;17:685–700. doi: 10.1007/s40201-019-00384-9. [DOI] [PMC free article] [PubMed] [Google Scholar]
- 10.Larsson K, Lindh CH, Jönsson BA, Giovanoulis G, Bibi M, Bottai M, et al. Phthalates, non-phthalate plasticizers and bisphenols in swedish preschool dust in relation to children’s exposure. Environ Int. 2017;102:114–24. doi: 10.1016/j.envint.2017.02.006. [DOI] [PubMed] [Google Scholar]
- 11.Baca SG, Reetz MT, Goddard R, Filippova IG, Simonov YA, Gdaniec M, et al. Coordination polymers constructed from o-phthalic acid and diamines: Syntheses and crystal structures of the phthalate-imidazole complexes {[cu (pht)(im) 2]· 1.5 h2o} n and [co (pht)(im) 2] n and their application in oxidation catalysis. Polyhedron. 2006;25:1215–22. doi: 10.1016/j.poly.2005.09.003. [DOI] [Google Scholar]
- 12.Faouzi M, Dine T, Gressier B, Kambia K, Luyckx M, Pagniez D, et al. Exposure of hemodialysis patients to di-2-ethylhexyl phthalate. Int J Pharm. 1999;180:113–21. doi: 10.1016/S0378-5173(98)00411-6. [DOI] [PubMed] [Google Scholar]
- 13.Heudorf U, Mersch-Sundermann V, Angerer J. Phthalates: Toxicology and exposure. Int J Hyg Environ Health. 2007;210:623–34. doi: 10.1016/j.ijheh.2007.07.011. [DOI] [PubMed] [Google Scholar]
- 14.Mersiowsky I, Weller M, Ejlertsson J. Fate of plasticised pvc products under landfill conditions: A laboratory-scale landfill simulation reactor study. Water Res. 2001;35:3063–70. doi: 10.1016/S0043-1354(01)00027-6. [DOI] [PubMed] [Google Scholar]
- 15.Shaikh H, Memon N, Khan H, Bhanger M, Nizamani S. Preparation and characterization of molecularly imprinted polymer for di (2-ethylhexyl) phthalate: Application to sample clean-up prior to gas chromatographic determination. J Chromatogr A. 2012;1247:125–33. doi: 10.1016/j.chroma.2012.05.056. [DOI] [PubMed] [Google Scholar]
- 16.Mailhot G, Sarakha M, Lavedrine B, Caceres J, Malato S. Fe (iii)-solar light induced degradation of diethyl phthalate (dep) in aqueous solutions. Chemosphere. 2002;49:525–32. doi: 10.1016/S0045-6535(02)00418-6. [DOI] [PubMed] [Google Scholar]
- 17.Ogunfowokan A, Torto N, Adenuga A, Okoh E. Survey of levels of phthalate ester plasticizers in a sewage lagoon effluent and a receiving stream. Environ Monit Assess. 2006;118:457–80. doi: 10.1007/s10661-006-1500-z. [DOI] [PubMed] [Google Scholar]
- 18.Asakura H, Matsuto T, Tanaka N. Behavior of endocrine-disrupting chemicals in leachate from msw landfill sites in japan. Waste Manag. 2004;24:613–22. doi: 10.1016/j.wasman.2004.02.004. [DOI] [PubMed] [Google Scholar]
- 19.Marttinen SK, Kettunen RH, Rintala JA. Occurrence and removal of organic pollutants in sewages and landfill leachates. Sci Total Environ. 2003;301:1–12. doi: 10.1016/S0048-9697(02)00302-9. [DOI] [PubMed] [Google Scholar]
- 20.Fromme H, Küchler T, Otto T, Pilz K, Müller J, Wenzel A. Occurrence of phthalates and bisphenol a and f in the environment. Water Res . 2002;36:1429–1438. doi: 10.1016/S0043-1354(01)00367-0. [DOI] [PubMed] [Google Scholar]
- 21.Adibi JJ, Perera FP, Jedrychowski W, Camann DE, Barr D, Jacek R, et al. Prenatal exposures to phthalates among women in new york city and krakow, poland. Environ Health Perspect. 2003;111:1719–22. doi: 10.1289/ehp.6235. [DOI] [PMC free article] [PubMed] [Google Scholar]
- 22.Foster P, Cattley R, Mylchreest E. Effects of di-n-butyl phthalate (dbp) on male reproductive development in the rat: Implications for human risk assessment. Food Chem Toxicol. 2000;38:97–9. doi: 10.1016/S0278-6915(99)00128-3. [DOI] [PubMed] [Google Scholar]
- 23.Schmidt J-S, Schaedlich K, Fiandanese N, Pocar P, Fischer B. Effects of di (2-ethylhexyl) phthalate (dehp) on female fertility and adipogenesis in c3h/n mice. Environ Health Perspect. 2012;120:1123–9. doi: 10.1289/ehp.1104016. [DOI] [PMC free article] [PubMed] [Google Scholar]
- 24.Alinejad A, Akbari H, Ghaderpoori M, Jeihooni AK, Adibzadeh A. Catalytic ozonation process using a mgo nano-catalyst to degrade methotrexate from aqueous solutions and cytotoxicity studies in human lung epithelial cells (a549) after treatment. RSC Adv. 2019;9:8204–14. doi: 10.1039/C9RA00320G. [DOI] [PMC free article] [PubMed] [Google Scholar]
- 25.Azarpira H, Sadani M, Abtahi M, Vaezi N, Rezaei S, Atafar Z, et al. Photo-catalytic degradation of triclosan with uv/iodide/zno process: Performance, kinetic, degradation pathway, energy consumption and toxicology. J Photochem Photobiol A. 2019;371:423–32. doi: 10.1016/j.jphotochem.2018.10.041. [DOI] [Google Scholar]
- 26.Ghaderpoori M, Dehghani MH. Investigating the removal of linear alkyl benzene sulfonate from aqueous solution by ultraviolet irradiation and hydrogen peroxide process. Desalin Water Treat. 2016;57:15208–12.
- 27.Kamarehie B, Jafari A, Ghaderpoori M, Amin Karami M, Mousavi K, Ghaderpoury A. Catalytic ozonation process using pac/γ-fe2o3 to alizarin red s degradation from aqueous solutions: A batch study. Chem Eng Commun. 2019;206:898–908. doi: 10.1080/00986445.2018.1537266. [DOI] [Google Scholar]
- 28.Ejlertsson J, Alnervik M, Jonsson S, Svensson BH. Influence of water solubility, side-chain degradability, and side-chain structure on the degradation of phthalic acid esters under methanogenic conditions. Environ Sci Technol. 1997;31:2761–4. doi: 10.1021/es961055x. [DOI] [Google Scholar]
- 29.Golmohammadi S, Ahmadpour M, Mohammadi A, Alinejad A, Mirzaei N, Ghaderpoori M, et al. Removal of blue cat 41 dye from aqueous solutions with zno nanoparticles in combination with us and us-h2o2 advanced oxidation processes. Environ Health Eng Manag J. 2016;3:107–13. doi: 10.15171/EHEM.2016.08. [DOI] [Google Scholar]
- 30.Kouklin N. Cu-doped zno nanowires for efficient and multispectral photodetection applications. Adv Mater. 2008;20:2190–4. doi: 10.1002/adma.200701071. [DOI] [Google Scholar]
- 31.Dhibar S, Dey A, Ghosh D, Mandal A, Dey B. Mechanically tuned molybdenum dichalcogenides (mos2 and mose2) dispersed supramolecular hydrogel scaffolds. J Mol Liq. 2019;276:184–93. doi: 10.1016/j.molliq.2018.11.159. [DOI] [Google Scholar]
- 32.Rahimi R, Shokraiyan J, Rabbani M, Fayyaz F. Enhanced photobactericidal activity of zno nanorods modified by meso-tetrakis (4-sulfonatophenyl) porphyrin under visible led lamp irradiation. Water Sci Technol. 2015;71:1249–54. doi: 10.2166/wst.2015.098. [DOI] [PubMed] [Google Scholar]
- 33.Wang GY, Zhang WX, Lian HL, Jiang DZ, Wu TH. Effect of calcination temperatures and precipitant on the catalytic performance of au/zno catalysts for co oxidation at ambient temperature and in humid circumstances. Appl Catal A. 2003;239:1–10. doi: 10.1016/S0926-860X(02)00098-4. [DOI] [Google Scholar]
- 34.Aparicio I, Santos J, Alonso E. Simultaneous sonication-assisted extraction, and determination by gas chromatography–mass spectrometry, of di-(2-ethylhexyl) phthalate, nonylphenol, nonylphenol ethoxylates and polychlorinated biphenyls in sludge from wastewater treatment plants. Analytica chimica acta. 2007;584:455–61. doi: 10.1016/j.aca.2006.11.039. [DOI] [PubMed] [Google Scholar]
- 35.Kalmykova Y, Moona N, Strömvall A-M, Björklund K. Sorption and degradation of petroleum hydrocarbons, polycyclic aromatic hydrocarbons, alkylphenols, bisphenol a and phthalates in landfill leachate using sand, activated carbon and peat filters. Water Res. 2014;56:246–57. doi: 10.1016/j.watres.2014.03.011. [DOI] [PubMed] [Google Scholar]
- 36.Eskandarloo H, Badiei A, Behnajady MA, Ziarani GM. Uv-leds assisted preparation of silver deposited tio2 catalyst bed inside microchannels as a high efficiency microphotoreactor for cleaning polluted water. Chem Eng J. 2015;270:158–67. doi: 10.1016/j.cej.2015.01.117. [DOI] [Google Scholar]
- 37.Hossaini H, Moussavi G, Farrokhi M. The investigation of the led-activated fefns-tio2 nanocatalyst for photocatalytic degradation and mineralization of organophosphate pesticides in water. Water Res. 2014;59:130–44. doi: 10.1016/j.watres.2014.04.009. [DOI] [PubMed] [Google Scholar]
- 38.Akbari-Adergani B, Saghi MH, Eslami A, Mohseni-Bandpei A, Rabbani M. Removal of dibutyl phthalate from aqueous environments using a nanophotocatalytic fe, ag-zno/vis-led system: Modeling and optimization. Environ Technol. 2018;39:1566–76. doi: 10.1080/09593330.2017.1332693. [DOI] [PubMed] [Google Scholar]
- 39.Hsieh PT, Chen YC, Kao KS, Wang CM. Luminescence mechanism of zno thin film investigated by xps measurement. Appl Phys A. 2008;90:317–21. doi: 10.1007/s00339-007-4275-3. [DOI] [Google Scholar]
- 40.Bauer M, Herrmann R. Estimation of the environmental contamination by phthalic acid esters leaching from household wastes. Sci Total Environ. 1997;208:49–57. doi: 10.1016/S0048-9697(97)00272-6. [DOI] [PubMed] [Google Scholar]