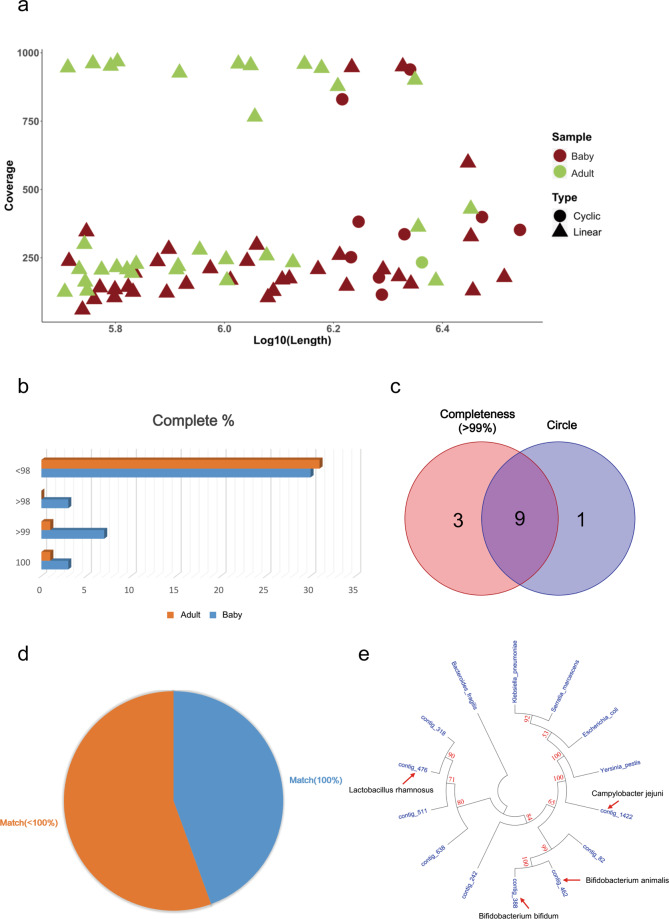
Fig. 2. The different aspects of the contigs (longer than 0.5 Mb) in the two samples.
a The length and coverage of the contigs in the two samples (longer than 0.5 Mb). b Complete analysis of the contigs in the two samples. c Wenn diagram shows the number of contigs (Complete ≥99% or circle). d Pie diagram shows the number of the nine genomes whether they match public genomes. e Phylogenetic tree of the nine assembled genomes, each arrow shows the completely matched contig.

