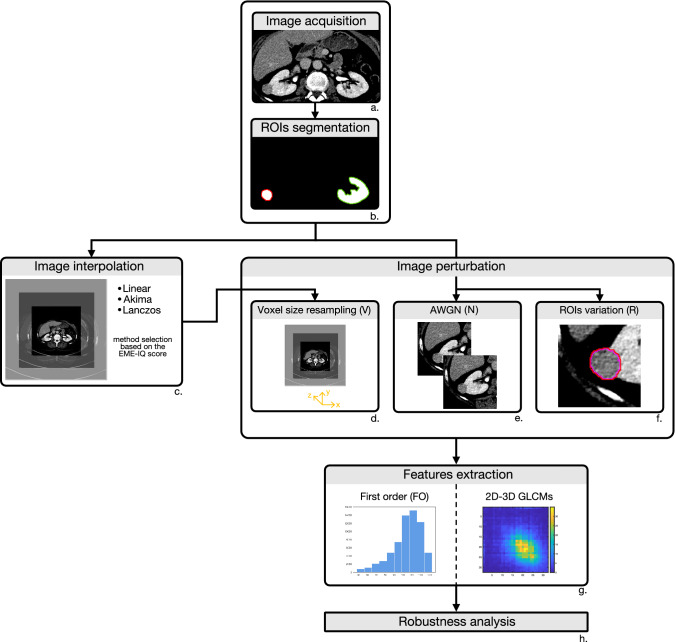
Figure 1.
Workflow of CT image processing for feature robustness analysis. First, CT images were acquired (a) and ROIs segmented (b). Then, one out of three resampling methods was chosen based on the highest EME-IQ score (c), then CT images were perturbed by changing resolution (d), noise addition (e), and ROI variation (f). Finally, first order, and 2D and 3D texture features based on GLCMs (g) were extracted from original and perturbed images and robustness analysis was performed (h).

