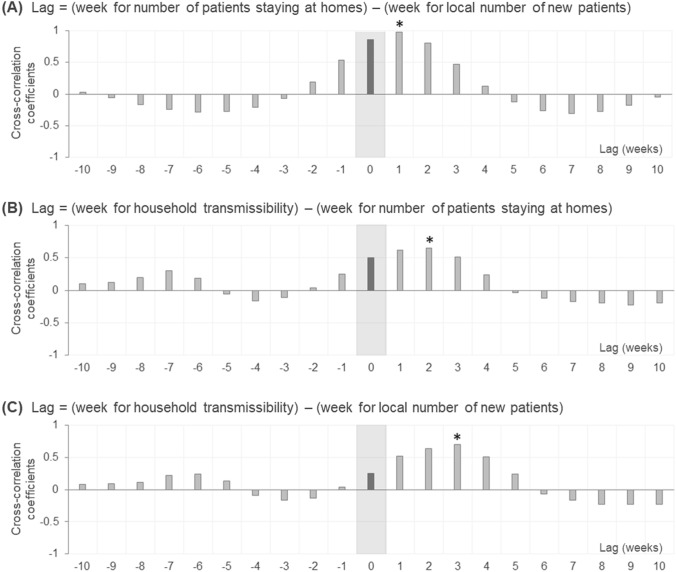
Figure 6.
Cross-correlograms between local epidemics, number of patients staying at home, and household COVID-19 transmissibility. The local COVID-19 epidemic status is represented by the weekly number of newly diagnosed COVID-19 patients. The gray filled areas show the cross-correlations between two simultaneous variables with no time lag. The asterisk indicates the lag that produces the largest cross-correlation coefficient, suggesting a time delay between the two assessed variables.

