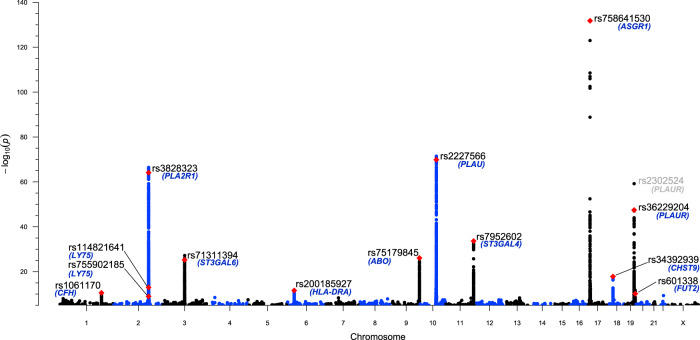
Fig. 1. suPAR GWAS meta-analysis Manhattan plot (N = 47,736), showing the 11 genome-wide significant loci and the 13 independently significant variants associated with suPAR.
The negative log10 transformed P values for variants are plotted by chromosomal location. Y axis begins at P = 1 × 10⁻⁵. Red points signify the 13 independently significant variants associated with suPAR, with variant IDs annotated in black and the corresponding gene annotated in blue.

