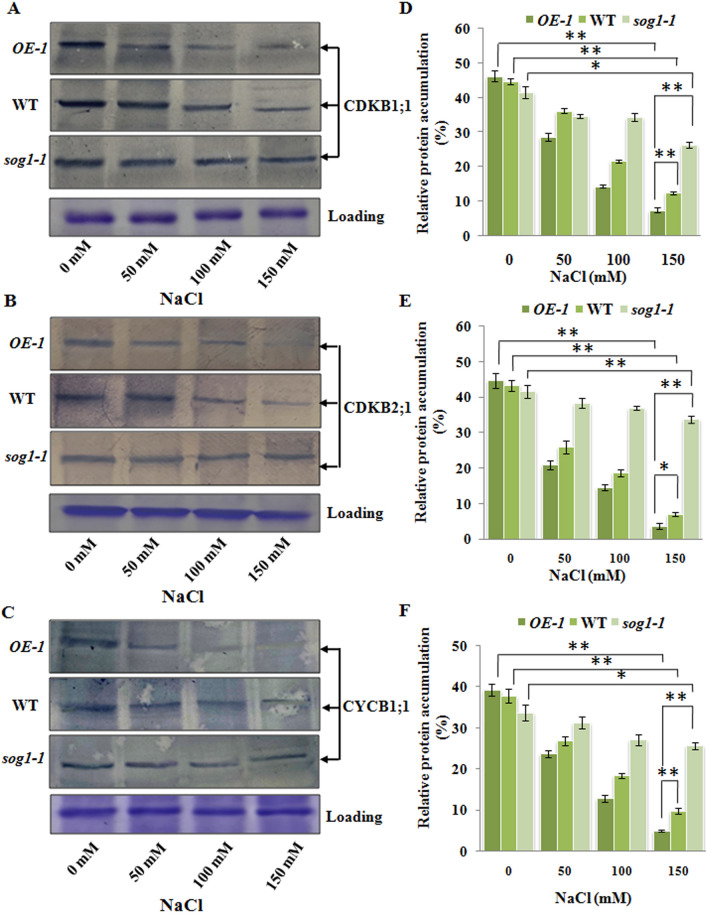
Figure 10.
SOG1 is found to control the entry into M-phase and induce cell cycle arrest under salinity stress. (A–C) Detection of protein accumulation levels of key regulators of cell cycle progression and endoreduplication including CDKB1;1 (A), CDKB2;1 (B), CYCB1;1 (C), respectively in 7-days old OE-1, wild-type and sog1-1 seedlings exposed to increasing concentrations of NaCl for 12 h. Loading control of total protein extracts has been presented in the lowermost panel. Immunoblotting was performed by using ~ 50 µg of total protein extracts. The blots were cut prior to incubation with the respective primary antibody\ies. Representative gel blot images from at least three independent experiments are shown. Replicates of the protein gel blots have been presented in Supplementary Fig. S15. (D–F) Quantification of band intensity to determine the accumulation levels of CDKB1;1 (D), CDKB2;1 (E), CYCB1;1 (F) proteins as detected by immunoblotting. Densitometry analysis was carried out by ImageJ software (NIH). Error bar indicates standard deviation. Asterisks indicate significant statistical differences (*p < 0.05, **p < 0.01) from control (without NaCl treatment) using one-way ANOVA factorial analysis.

