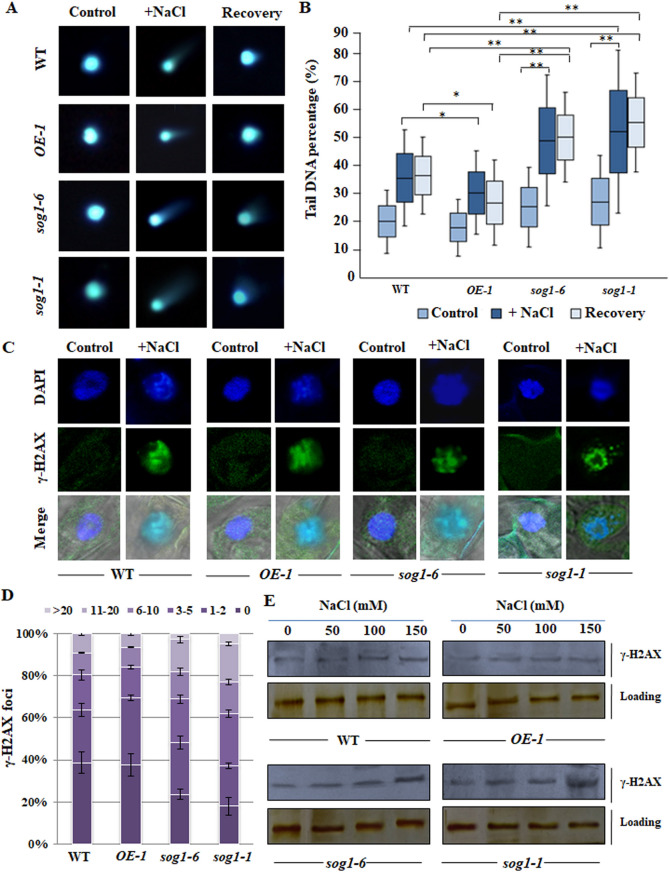
Figure 3.
Salinity induced accumulation of DSBs. (A) Representative Comet images of 7-days old wild-type, OE-1, sog1-6 and sog1-1 mutant plants incubated without NaCl for 1 h (control) and incubated with 150 mM NaCl for 12 h and then transferred to medium without NaCl for 5 h (recovery) (left, middle and right panel respectively). (B) Box plot of percentages of tail DNA of 7-days old wild-type, OE-1, sog1-6 and sog1-1 mutant plants. DNA percentage in the comet tails were determined by using TriTek Comet Score software. Box plots are based on analysis of approximately 100 cells per experimental sample from random microscopic fields of three independent biological replicates. Each box represents the interquartile range (IQR) of DNA damage, the line across each box represents the median value and the whiskers represent 5–95 percentile values. Brackets connect box plots of sample groups with significant statistical difference (*p < 0.05, **p < 0.01). (C) Immunostaining of γ-H2AX foci in the root cells of wild-type, overexpressor line and mutant line plants after 12 h of treatment without and with 150 mM NaCl, respectively. (D) Counted numbers of γ-H2AX foci per cell detected after 12 h of treatment with 150 mM NaCl in plants of all the genotypes. According to their number of γ-H2AX foci, approximately 100 nuclei for each sample were grouped into six classes; cell with 0, 1–2, 3–5, 6–10, 11–20 and > 20 foci per nuclei. (E) Detection of γ-H2AX accumulation by immunoblot analysis using the total histone protein isolated from untreated and NaCl treated of 7-days old wild-type, OE-1, sog1-6 and sog1-1 mutant plants, respectively. The blots were cut prior to incubation with the primary antibody. Replicates of the protein gel blots have been presented in Supplementary Fig. S11.

