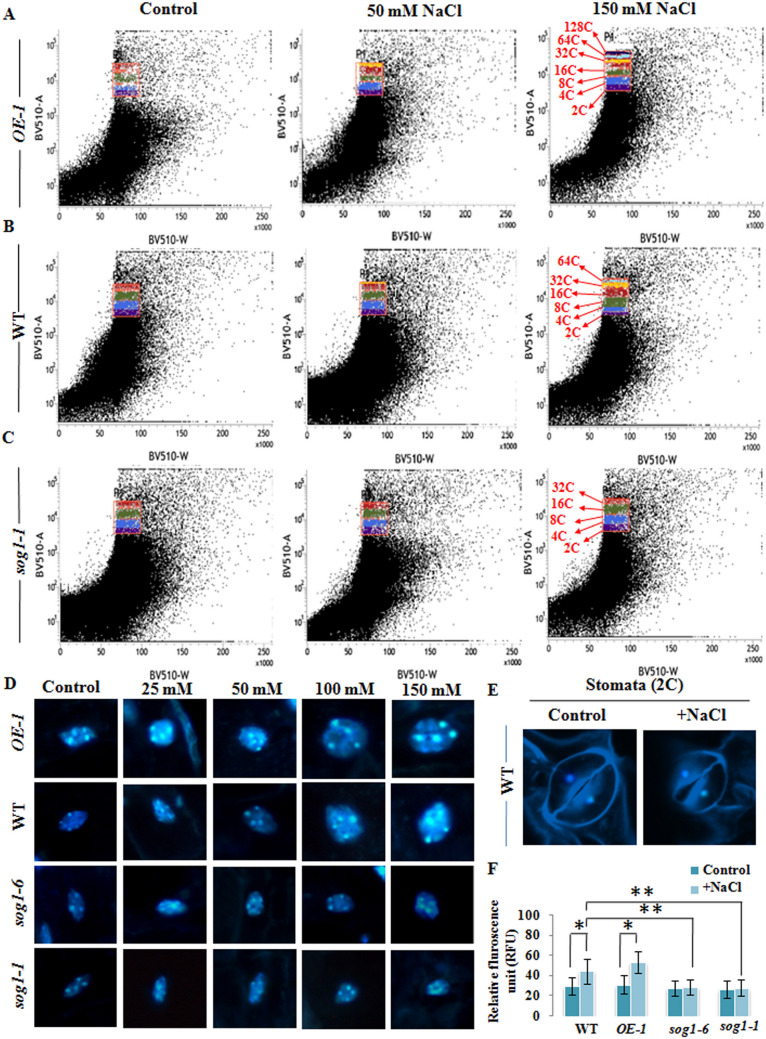
Figure 5.
Salinity induced endoreduplication and nuclear area expansion. (A–C) Scatter plots showing DNA ploidy distribution in root tip nuclei of 7-days old OE-1, wild-type and sog1-1 mutant plants treated without or with 50 and 150 mM NaCl. (D) Confocal imaging of DAPI-stained nuclei in the root cells of 7-days old OE-1, wild-type, sog1-6 and sog1-1 mutant seedlings (first, second, third and fourth panel, respectively); Scale bar: 10 μm. (E) The nuclei in a pair of wild-type stomata cells represent 2C. Strongly stained dots in each nucleus correspond to centromeres. (F) Measurement of in-situ fluorescence in DAPI-stained root tip nuclei of wild-type, OE-1, sog1-6 and sog1-1 mutant seedlings. Each bar represents the mean value of three independent replicates. Error bar indicates standard deviation. Asterisks indicate significant statistical differences (*p < 0.05, **p < 0.01) from control (without NaCl treatment) using one-way ANOVA factorial analysis.

