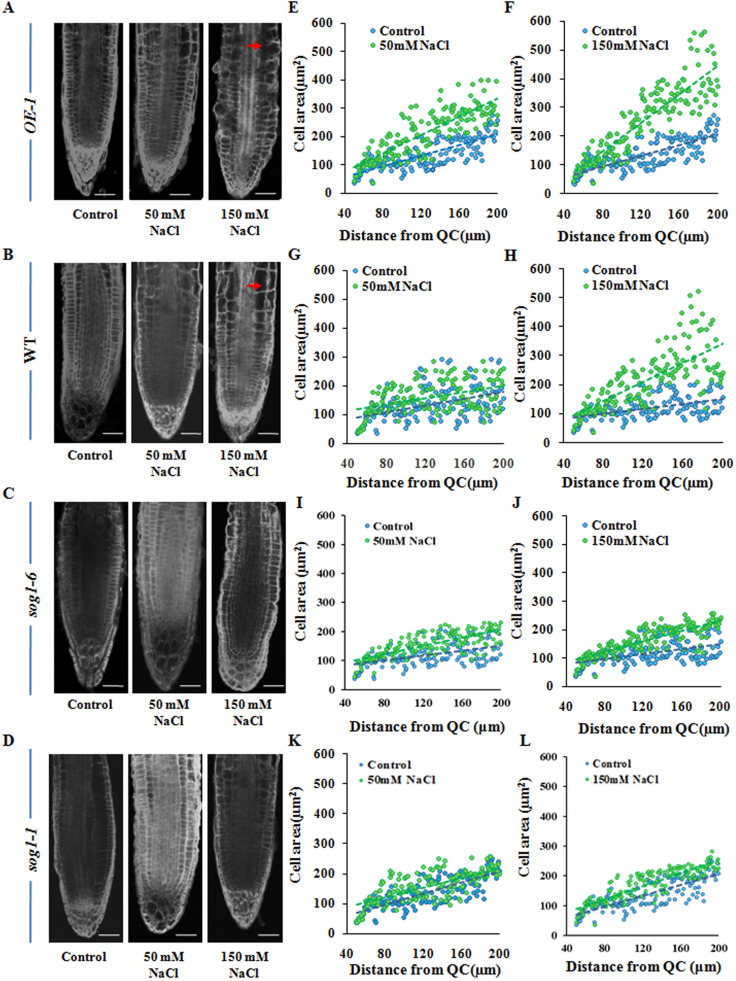
Figure 6.
Salinity induced cell area expansion in the root tip epidermal cells. (A–D) Propidium iodide stained root tip cells of 7-days old OE-1, wild-type, sog1-6 and sog1-1 mutant seedlings respectively, either treated without or with 50 and 150 mM NaCl. Red arrows showing increase in cell size. Scale bar: 50 μm. (E–L) Measurement of area of root tip cells situated between 40 and 200 μm from the quiescent centre (QC) using ImageJ software (NIH). Regression lines included in (E–L); For OE-1 (E,F), R2 = 0.421 (Control), 0.598 (50 mM), 0.787 (150 mM); for wild-type (G,H), R2 = 0.507 (Control), 0.617 (50 mM), 0.713 (150 mM); for sog1-6 (I,J), R2 = 0.228 (Control), 0.236 (50 mM), 0.354 (150 mM) and for sog1-1 (K,L), R2 = 0.181 (Control), 0.191 (50 mM), 0.204 (150 mM). The F value was found to be < 0.001 for all regression analyses.

