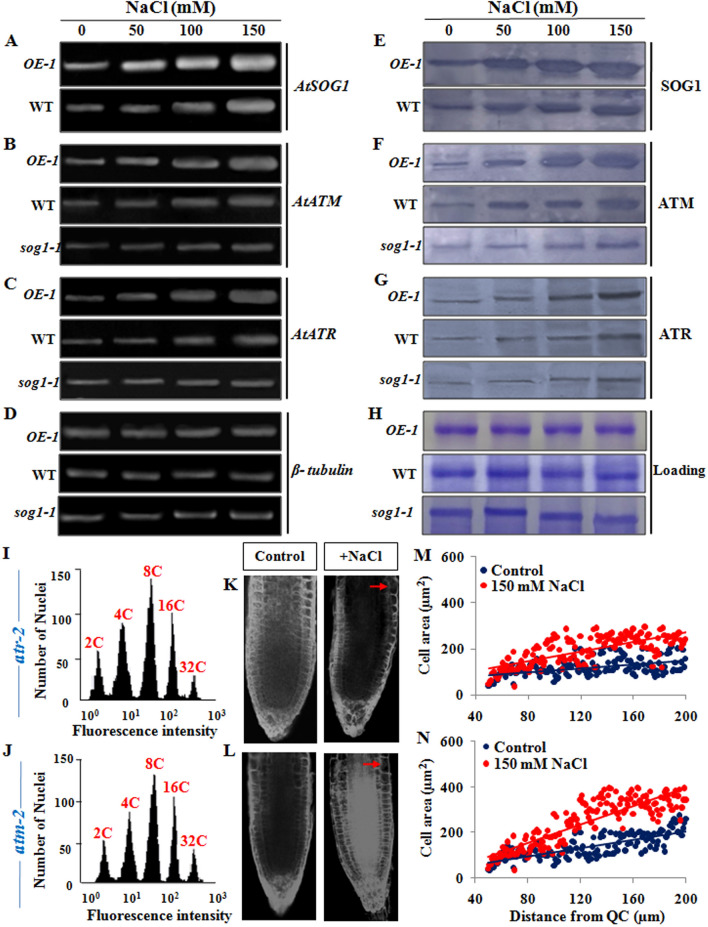
Figure 9.
Salinity induced activation of ATM-SOG1 and ATR-SOG1 pathways. (A) Semi-quantitative reverse transcription-PCR analysis showing expression level of AtSOG1 in OE-1 and wild-type seedlings exposed to increasing concentrations of NaCl for 12 h. (B–D) Transcript accumulation levels of AtATM, AtATR and β-tubulin genes, respectively in OE-1, wild-type and sog1-1 seedlings exposed to increasing concentrations of NaCl for 12 h. β-tubulin served as the housekeeping gene. Quantitative analyses of relative expression of AtSOG1, AtATM and AtATR genes have been presented in Supplementary Fig. S7. Images of full-length gels have been presented in Supplementary Fig. S13. (E) Detection of protein accumulation level of SOG1 in OE-1 and wild-type seedlings exposed to increasing concentrations of NaCl for 12 h. (F–G) Detection of protein accumulation levels of key DNA damage response transducers, including ATM and ATR, respectively in 7-days old OE-1, wild-type and sog1-1 seedlings exposed to increasing concentrations of NaCl. The blots were cut prior to incubation with the respective primary antibodies. (H) Respective loading control of total protein extracts from OE-1, wild-type and sog1-1 seedlings respectively. Immunoblotting was performed by using ~ 50 µg of total protein extracts. Representative gel blot images from at least three independent experiments are shown. Replicates of the protein gel blots have been presented in Supplementary Fig. S14. (I,J) Flowcytometric analysis of ploidy level in the propidium iodide DAPI-stained root cell nuclei of 7-days old atr-2 and atm-2 mutant plants treated without or with 150 mM NaCl. (K,L) Propidium iodide stained root tips of 7-days old atr-2 and atm-2 mutant seedlings respectively, either treated without or with 150 mM NaCl. Red arrows showing enlarged root epidermal cells. Scale bar: 50 μm. (M,N) Measurement of area of root tip cells situated between 40 and 200 μm from the quiescent centre (QC) using ImageJ software (NIH). Regression lines included in (M,N); for atr-2 (M) R2 = 0.224 (Control), 0.506 (150 mM) and for atm-2 (N) R2 = 0.597 (control), 0.744 (150 mM).

