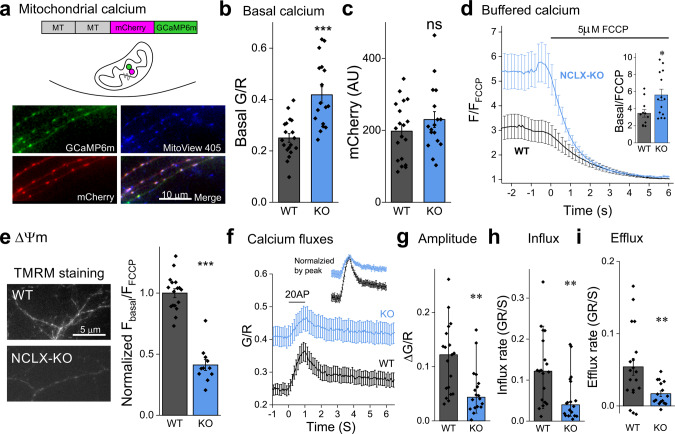
Fig. 2. NCLX deletion increases resting mitochondrial calcium levels, depolarizes mitochondria and weakens calcium clearance during neuronal activity.
a Ratiometric measurement of mitochondrial calcium using MitoRGCaMP. MitoRGCaMP includes two mitochondrial targeting sequences (MT), calcium-insensitive mCherry and GcAMP6m, inducing localization of MitoRGCaMP to the mitochondrial matrix. Shown is an example of axons of WT primary hippocampal neurons expressing MitoRGCaMP to which the vital stain MitoView 405 was applied to label mitochondria, illustrating that the green and red components of MitoRGCaMP colocalize within the mitochondria. b Deletion of NCLX increases basal mitochondrial calcium levels. Quantification of the ratio between the fluorescence intensity of GCaMP6m (G) and that of mCherry (R) in the mitochondria of resting neurons in WT and NCLX-KO neurons (0.25 ± 0.02, 0.42 ± 0.03 mean ± SEM G/R), n = 17 and 19, respectively, ~50 mitochondria each, ***p = 2e–5, two-sided Student’s t test (t = −4.832, DF = 34). c Mitochondrial volume is unaffected by deletion of NCLX. Quantification of the fluorescence values of the calcium-insensitive mCherry component of MitoRGCaMP in the axonal mitochondria (as in (b)). No significant difference was observed between WT and NCLX-KO mitochondria (197.7 ± 18.3, 230.1 ± 22.2 mean ± SEM AU), n = 17 and 19, respectively, ~50 mitochondria each, ns p = 0.27, two-sided Student’s t test (t = −1.133, DF = 34). d Buffered calcium levels in axonal NCLX-KO mitochondria are lower. Depolarizing the mitochondria by bath application of FCCP (bar) leads to a leak of buffered mitochondrial calcium. FCCP was applied to neurons expressing MitoGCaMP6m in the absence of extracellular calcium to avoid mitochondrial calcium transients related to influx of calcium into the cytoplasm during plasma-membrane depolarization. Fluorescence intensity (F) per each mitochondrion was normalized by the value measured during the FCCP-induced plateau (FFCCP). Inset: Ratio of fluorescence measured before and after the application of FCCP (3.46 ± 0.44, 5.61 ± 0.68 mean ± SEM F/FFCCP), n = 11 and 14, respectively, >75 mitochondria each, *p = 0.021, two-sided Student’s t test (t = −2.487, DF = 23). e Mitochondria in NCLX-KO neurons are depolarized. Shown are representative fluorescence images of NCLX-KO and WT cultured hippocampal neurons bathed with the ∆Ψm indicator TMRM. FCCP was applied after baseline imaging to normalize the signal, as in (d). Initial F/FFCCP values were lower in NCLX KO neurons (1 ± 0.03, 0.41 ± 0.04 mean ± SEM, normalized by average WT value), n = 17 and 11, respectively, >25 mitochondria each, ***p = 1e–10, two-sided Student’s t test (t = 10.35, DF = 26). f Action-potential induced influx and efflux of calcium into mitochondria. Cultured hippocampal neurons expressing MitoRGCaMP were stimulated for 1 s at 20 Hz (bar) in the presence of APV and DNQX to block recurrent activity. Of note, the baseline value for the two genotypes is different (see (b)). Shown are mean ± SEM G/R traces. Image acquisition rate was 17.5 Hz. Inset: the same traces normalized by the peak of each trace. g Mitochondrial calcium transients in NCLX-KO neurons are smaller. ΔG/R (peak- baseline) values, n = 19 and 18, respectively, ~50 mitochondria each, **p = 0.0037, Mann–Whitney test (U = 267, Z = 2.902), bars indicate medians and the error bars the 10–90 percentiles. h Calcium influx rate in NCLX-KO neurons is slower. Initial calcium influx rates, each calculated by performing a linear fit of the fluorescence values during the first 0.5 s of stimulation, n = 19 and 18, respectively, ~50 mitochondria each, **p = 0.0032, Mann–Whitney test (U = 266, Z = 2.872), bars indicate medians and the error bars the 10–90 percentiles. i Calcium efflux rate in NCLX-KO neurons is slower. Initial calcium efflux rates, each calculated by performing a linear fit of the fluorescence values during the first 0.5 s after cessation of stimulation (0.054 ± 0.012, 0.017 ± 0.004 mean ± SEM GR/S), n = 19 and 16, respectively, ~50 mitochondria each, **p = 0.008, two-sided Student’s t test (t = −2.812, DF = 33).

