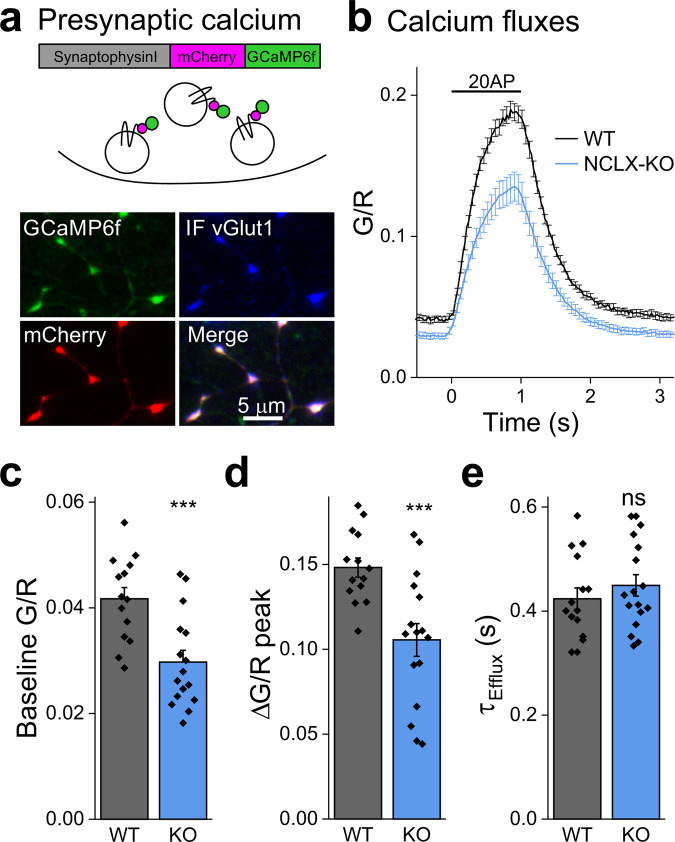
Fig. 3. Basal and activity-induced cytoplasmic presynaptic calcium levels in WT and NCLX-KO neurons.
a Ratiometric measurement of cytoplasmic presynaptic calcium using SyRGCaMP. SyRGCaMP is constructed of synaptophysin I, mCherry (R) and GCaMP6f (G). Middle—SyRGCaMP is localized to synaptic vesicles. Shown is a representative image of synapses of WT primary neurons infected with SyRGCaMP and immunostained for vGlut1, a synaptic vesicle protein (blue), showing localization of SyRGCaMP on SVs. b Stimulation-induced synaptic calcium transients. WT and NCLX-KO neurons expressing SyRGCaMP were stimulated at 20 Hz for 1 s (bar). GCaMP6f fluorescence (G) was measured throughout and divided by mCherry fluorescence ratio (R), producing the (G/R) ratio. Shown are mean ± SEM G/R traces of n = 14 and 16 experiments, respectively, >55 boutons each. c Basal cytoplasmic calcium is lower in presynaptic terminals of NCLX-KO neurons. Distribution of mean basal G/R values calculated in 20 images acquired prior to stimulation, as in (b) (0.042 ± 0.002, 0.029 ± 0.002 mean ± SEM G/R), ***p = 0.0006, two-sided Student’s t test (t = 3.852, DF = 28). d Calcium transients are smaller in presynaptic terminals of NCLX-KO neurons. Increase in G/R values from baseline to peak, as in (b) (0.148 ± 0.006, 0.106 ± 0.010 mean ± SEM G/R), ***p = 0.001, two-sided Student’s t test (t = 3.67, DF = 28). e Calcium extrusion time constant unaffected by NCLX deletion. Time constants of the decay in G/R over time in (b), calculated by fitting a single exponent function to each trace (0.43 ± 0.02, 0.44 ± 0.02 mean ± SEM second), ns p = 0.73, two-sided Student’s t test (t = −0.344, DF = 28).

