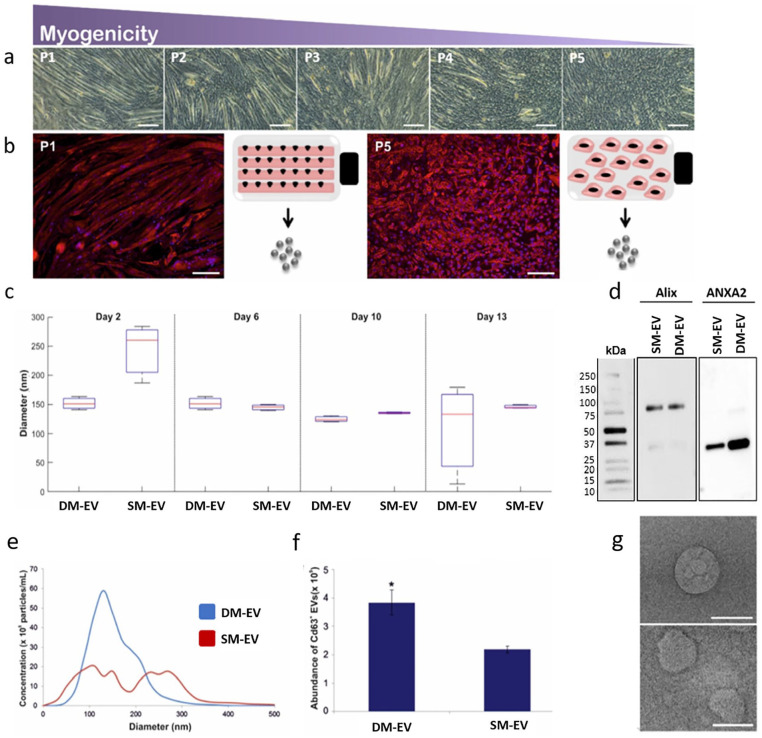
Figure 1.
The isolation and profiling of EVs isolated from DM and SMs: (a) optical micrographs displaying a progressive reduction in myogenesis during five rounds of selection for SMs (P1 to P5), (b) fluorescence microscopy images highlight changes in the cytoskeletal arrangement of actin in (P1) and SM (P5) that evidence limited myotube formation in the latter, scale bars represent 100 μm, (c) comparative dynamic light scattering (DLS) analysis of vesicle diameter over a period of 13 days myogenic culture, (d) western blotting for common EV markers, Alix and ANAXA2. Samples were run on the same gel, with 5 µg protein loaded for each. Length of exposure was adjusted for each protein at the time of image acquisition, (e) nanoparticle particle tracking (NTA) analysis confirming initial differences in EV diameter between DM-EVs and SM-EVs after two days in myogenic medium, (f) enzyme-linked immunosorbent assay (ELISA) for the EV tetraspanin marker CD63 displaying significant differences in the concentration of CD63+ EVs isolated from DM (3.84 × 10⁹) and SM (2.19 × 10⁹), and (g) transmission electron micrographs of DM-EVs (top) and SM-EVs (bottom). Scale bars 200 nm.

