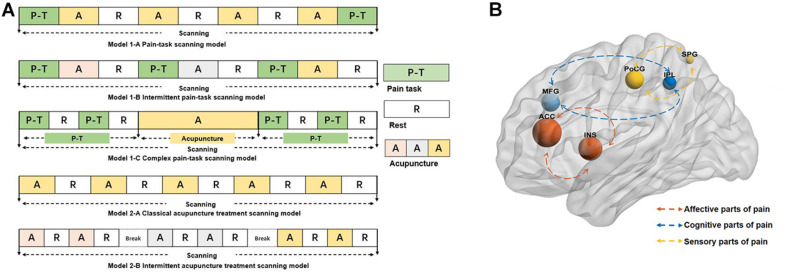
FIGURE 2.
(A) The models of neuroimaging scanning. The different color A represents the different intensity or modality of acupuncture. (B) The reported brain regions in the studies. The size of the nodes represents the frequency the reported brain regions, the different color of the nodes represents the different roles of the process of the pain. The blue nodes mainly represent the role of processing the cognitive parts of pain, the red nodes mainly represent the role of processing the affective parts of pain, and the yellow nodes mainly represent the role of processing the sensory part of pain. ACC, anterior cingulate cortex; INS, insula; MFG, middle frontal gyrus; PoCG, postcentral gyrus; IPL, inferior parietal gyrus; SPG, superior parietal gyrus.

