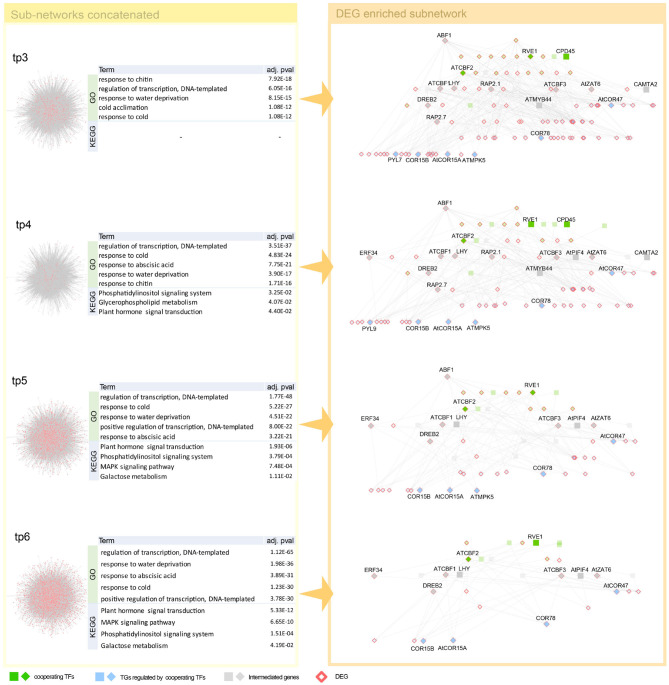
Figure 5.
Network dynamics of a gene regulatory network (GRN) sub-network after cold stress over time. Networks in the left panel shows the change in gene–gene relationship, in particular, TF–TG regulation. DEGs are denoted as pink. Four tables in the middle summarize top five most enriched biological pathways with p-value corrected by false discovery rate (FDR) < 0.05. Cold stress related Gene Ontology (GO) terms are enriched in GO enrichment tests with DEGs. The networks in the right panel are dynamics of a TF–TG sub-network that are DEG enriched. TFs were denoted with green nodes. Blue nodes denote TGs and gray nodes denote genes connected to transcription factors (TFs) and target genes (TGs). Square nodes denote DEGs that are detected by limma with FDR < 0.05. We showed GRN from tp3 to tp6, since GRN constructed in tp1 and tp2 is too small because the number of DEGs are too small in tp1 and tp2—41 and 23, respectively.

