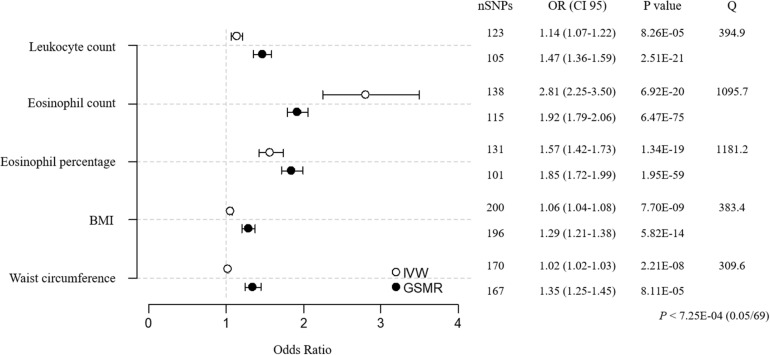
FIGURE 1.
MR estimates for associations between 5 environment factors and asthma. The odds ratio is plotted as dots with the 95% confidence interval. White dots are the IVW method, and black dots are the GSMR method. The P value indicates significance when P < 7.25E-04 (0.05/69) by Bonferroni correction. The Q value by Cochran’s Q statistic indicates residual heterogeneity in the MR estimates.

