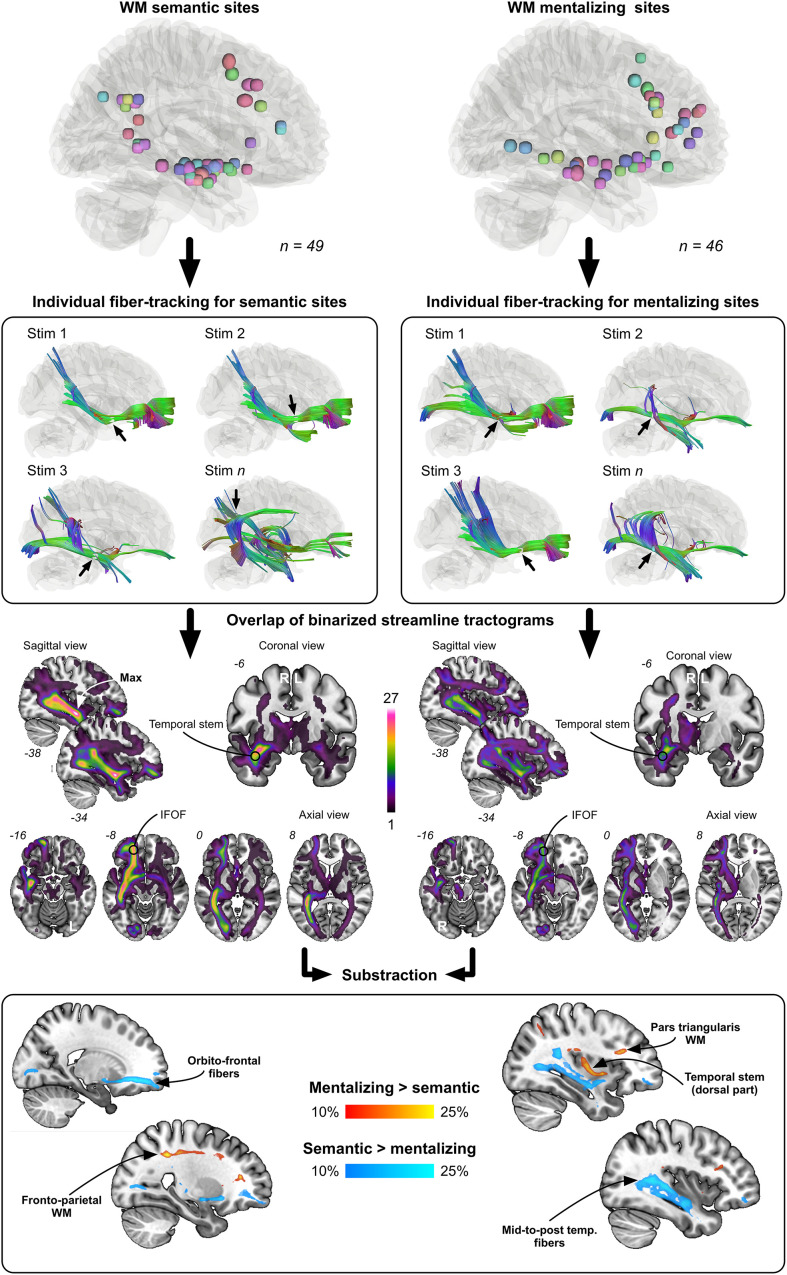
FIGURE 5.
Results from the disconnection analysis. Each WM site was used to generate individual streamline tractograms. These tractograms were next binarized and overlapped according to each function (semantics vs. mentalizing). Last, the overlap maps were contrasted to visualize the fiber pathways the most frequently and specifically tracked from mentalizing sites (red to yellow color) and semantic sites (dark blue to light blue color).

