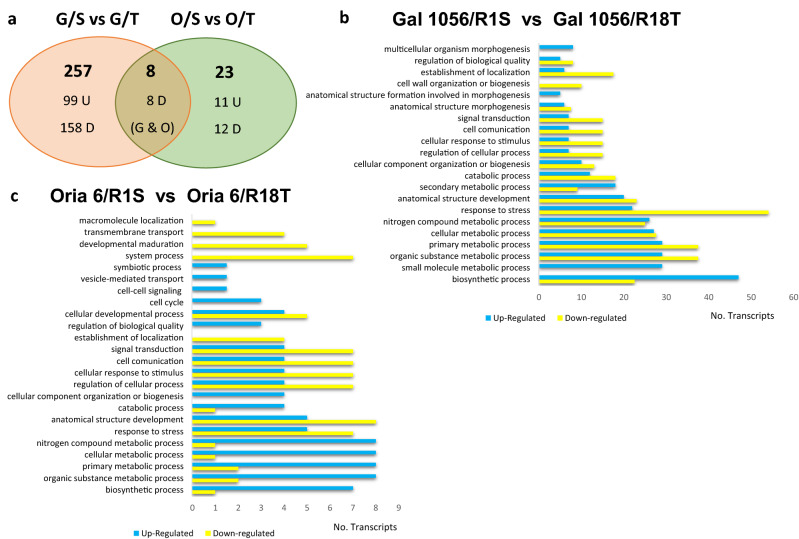
Figure 2.
DEGs identified in needles of drought-sensitive (G: Gal 1056) or drought-tolerant (O: Oria 6) scions grafted onto drought-sensitive (S: R1S) versus drought-tolerant (T: R18T) rootstocks. (a) Venn diagram showing DEGs [Log2FC ≤ − 1.5 and Log2FC ≥ 1.5] for upregulated (U) and downregulated DEGs (D), respectively. (b–c) Histogram presentation of GO terms enriched in significantly upregulated (blue) and downregulated (yellow) genes exclusively differentially expressed in G/S versus G/T (b) or O/S versus O/T (c) scions. P values (P < 0.05) were calculated according to the Wald test.

