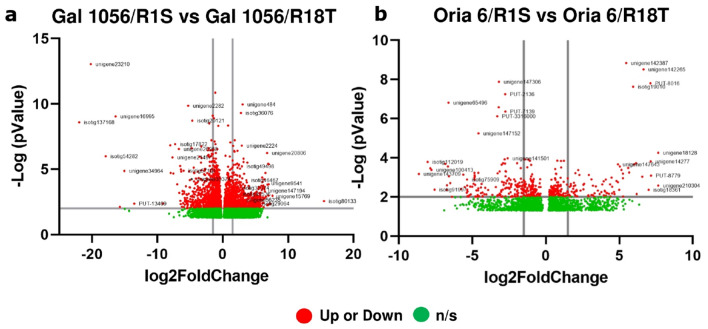
Figure 4.
Volcano plots of differential expression profiles comparing genes differentially expressed in needle scions of (a) Gal 1056/R1S versus Gal 1056/R18T and (b) Oria 6/R1S versus Oria 6/R18T grafts (up or down: significantly upregulated or downregulated genes [Log2FC ≤ − 1.5 and Log2FC ≥ 1.5]; n/s: no significant genes). The list of the genes is provided in Supplementary Table 3 and Supplementary Table 4. P values (P < 0.05) were calculated according to the Wald test.

