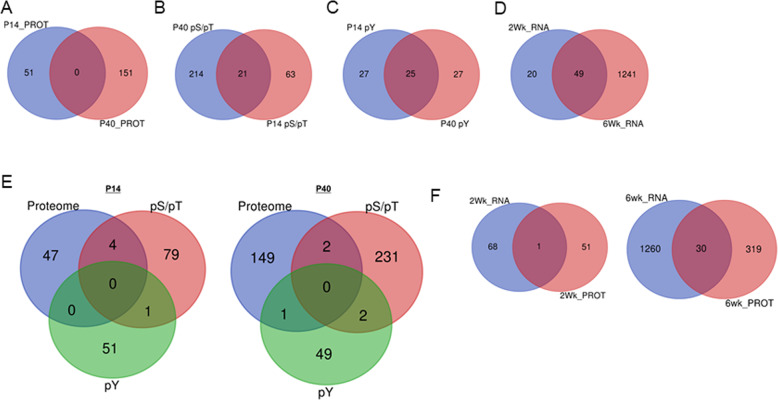
Fig. 2. Minimal to marginal overlap among the various –omic datasets.
A Venn diagram of protein IDs that are shared or not shared between P14 and P40 time points of the MUT vs WT proteomic scan. B Venn diagram of protein IDs that are shared or not shared between P14 and P40 time points of the MUT vs WT pS/pT phosphoproteomic scan. C Venn diagram of protein IDs that are shared or not shared between P14 and P40 time points of the MUT vs WT pY phosphoproteomic scan. D Venn diagram of gene IDs that are shared or not shared between P14 and P40 time points of the MUT vs WT transcriptome. E Venn diagram of protein IDs shared or not shared among the MUT versus WT proteome, pS/pT phosphoproteome, and pY phosphoproteome within time points P14 (left) and P40 (right). F Venn diagram of gene IDs shared or not shared between the transcriptome versus proteome within time points P14 (left) and P40 (right).

