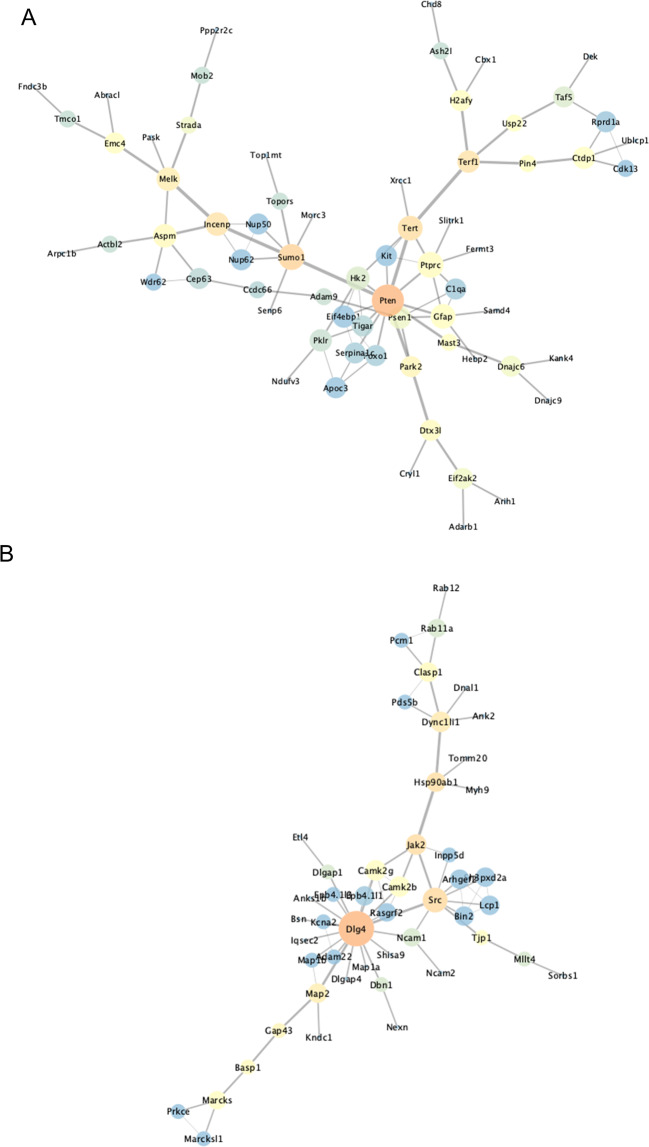
Fig. 4. Network analysis identifies major regulatory nodes in –omic data, such as Pten and Psd-95 (i.e., Dlg4).
A Largest network of related molecules constructed from P40 proteomic results (MUT vs WT) using STRING database. Node size trends with degree connectivity. Edge size trends with relationship evidence. Node color (warmth) trends with betweenness centrality. B Largest network of related molecules constructed from P40 pS/pT phosphoproteomic results (MUT vs WT) using STRING database. Node size trends with degree connectivity. Edge size trends with relationship evidence. Node color (warmth) trends with betweenness centrality.

