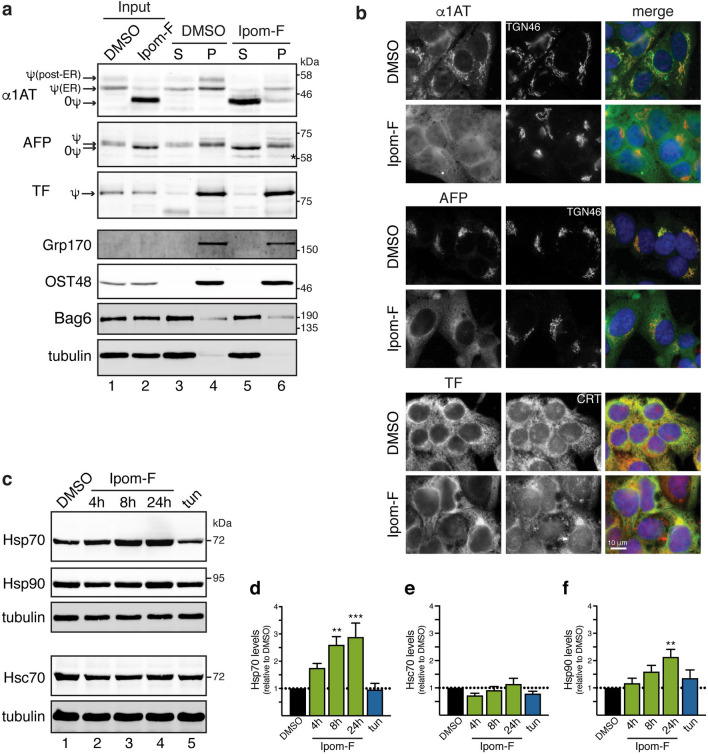
Figure 4.
Ipom-F-induced secretory protein precursors mislocalise to the cytosol. (a) HepG2 cells, treated with DMSO or Ipom-F (100 nM) for 16 h, were lysed mechanically before separation into supernatant (S) and pellet (P) fractions by ultracentrifugation. Inputs and equivalent amounts of each fraction were analysed by immunoblotting for the indicated proteins. Mature N-glycosylated (ψ) proteins and immature non-glycosylated (0ψ) precursors are indicated. The asterisk indicates a truncated form of AFP70,71. Grp170 (ER lumenal marker), OST48 (integral ER membrane marker) and Bag6 (cytosolic marker) remain uniformly in the pellet and supernatant fractions, respectively, and serve as fractionation controls. Full-length immunoblots are presented in Supplementary Fig. S6. (b) Representative wide-field fluorescence images of HepG2 cells treated as in (a) and immunolabelled against the indicated endogenous Sec61 client (green) and either TGN46 (trans-Golgi network; red) or CRT (ER; red). (c) HepG2 cells were treated with DMSO for 24 h, tunicamycin (tun; 5 μg/ml) for 17 h or Ipom-F (100 nM) for the indicated times. Detergent-soluble lysates were blotted for the indicated cytosolic chaperones. Representative immunoblots are shown (full-length blots presented in Supplementary Fig. S6). Please note that the Hsc70 immunoblot shown was also probed with anti-ATF6 antibodies using an Odyssey two colour detection system (LI-COR). Hence, the accompanying tubulin loading control is identical to that shown in Fig. 6e. (d–f) Infrared fluorescence-based quantification of chaperone expression as shown in (c). Values are mean ± s.e.m; n = 4–6; **P < 0.01; ***P < 0.001 relative to DMSO (one-way ANOVA).

