Figure 5.
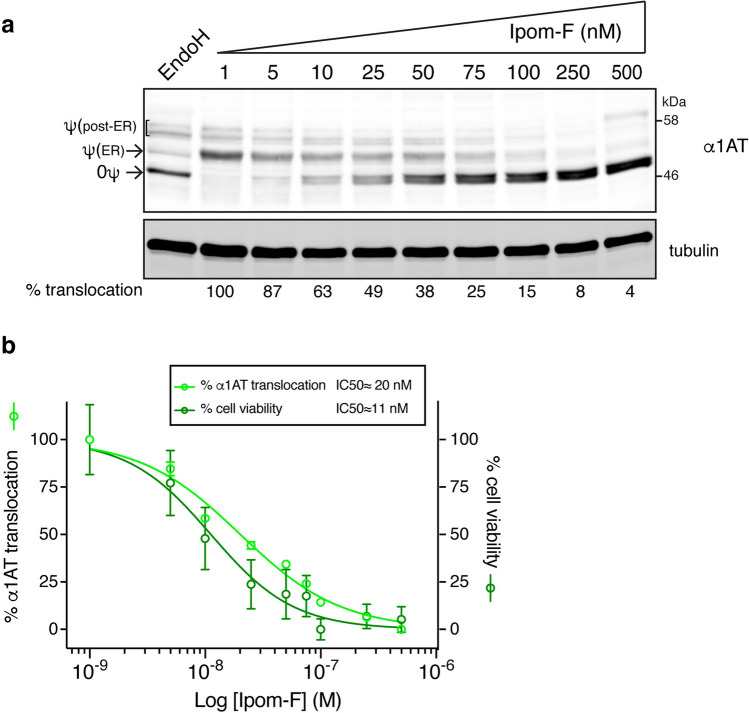
Potent inhibition of α1AT translocation into the ER by Ipom-F correlates with cytotoxicity. (a) HepG2 cells treated for 24 h with increasing concentrations of Ipom-F were analysed by immunoblotting for endogenous α1AT. The positions of non-glycosylated (0ψ) and N-glycosylated α1AT (ψ; ER and post-ER species) are indicated. Representative immunoblots shown (full-length blots presented in Supplementary Fig. S6). Infrared fluorescence-based quantification of the efficiency of α1AT translocation into the ER is indicated below the gel. The percentage of α1AT translocation was calculated by dividing the normalised signal intensity of the N-glycosylated species by the sum of N-glycosylated and non-glycosylated species within each lane. (b) Dose–response curves for the effect of 24 h Ipom-F treatment on the translocation of endogenous α1AT into the ER (calculated as in (a)) and cell viability measured using the MTT assay. Curves are means ± s.e.m of three independent experiments (performed in triplicate for the MTT assay). IC50 (half-maximal effective concentration) values of the dose-responses are shown.

