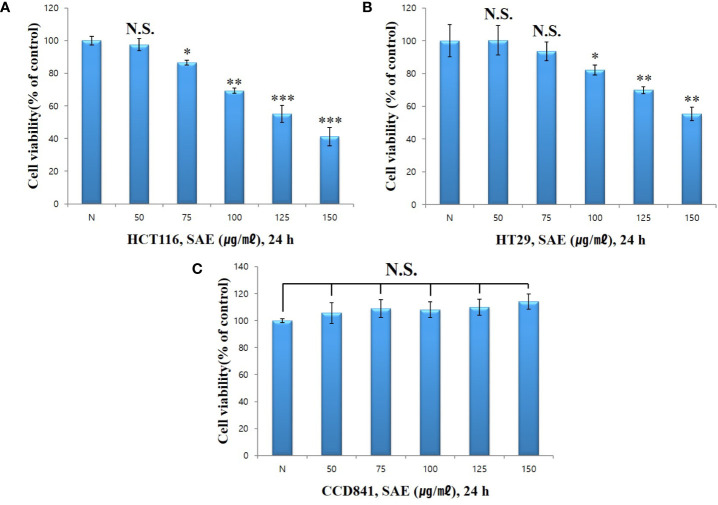
Figure 2.
The effect of SAE on the viability of HCT116, HT29, and CCD841 cells. Cell viability was measured by WST-1 assays. (A) HCT116 cells were pretreated with SAE for 24 h. (B) HT29 cells were pretreated with SAE for 24 h. (C) CCD841 cells were pretreated with SAE for 24 h. Statistical analysis was performed using t-tests. *p < 0.05, **p < 0.01 and ***p < 0.001 compared to the controls. N.S., not significant (each experiment, n = 3). N., Negative control; 50., SAE 50 µg/mL; 75., SAE 75 µg/mL; 100., SAE 100 µg/mL; 125., SAE 125 µg/mL; 150., SAE 150 µg/mL.

