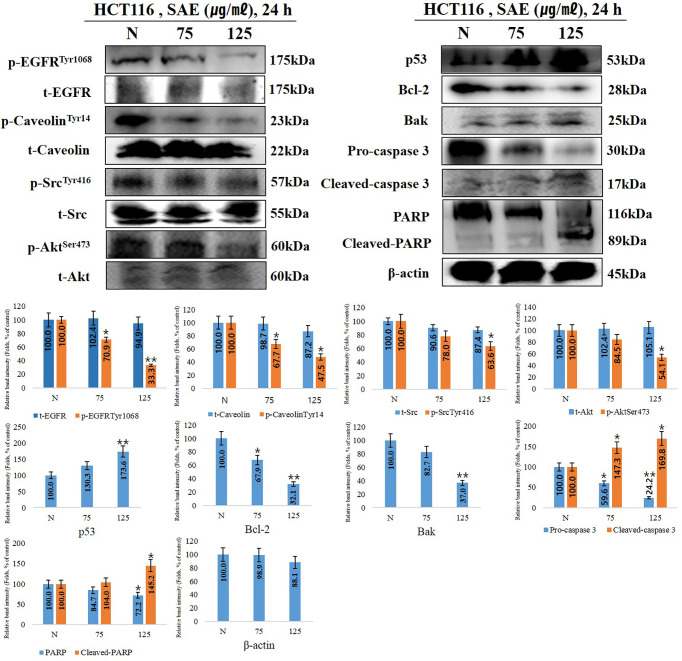
Figure 4.
The effects of SAE on the expression of anoikis regulatory proteins. HCT116 cells were treated with the indicated concentrations of SAE for 24 h. The expressions of p-EGFR, p-caveolin, t-caveolin, p-Src, t-Src, p-Akt, p53, Bcl-2, Bak, PARP, and cleaved-PARP. Pro-caspase 3, cleaved-caspase 3, and β-actin were analyzed by Western blotting (each experiment, n = 3). All Western blotting images were quantitatively represented using ImageJ (National Institutes of Health). Statistical analyses were performed using t-tests; *P < 0.05, **P < 0.01 compared to N groups (each experiment, n= 3). The error bars represent the standard error. N., Negative control; 75., SAE 75 µg/mL; 100., SAE 100 µg/mL.

