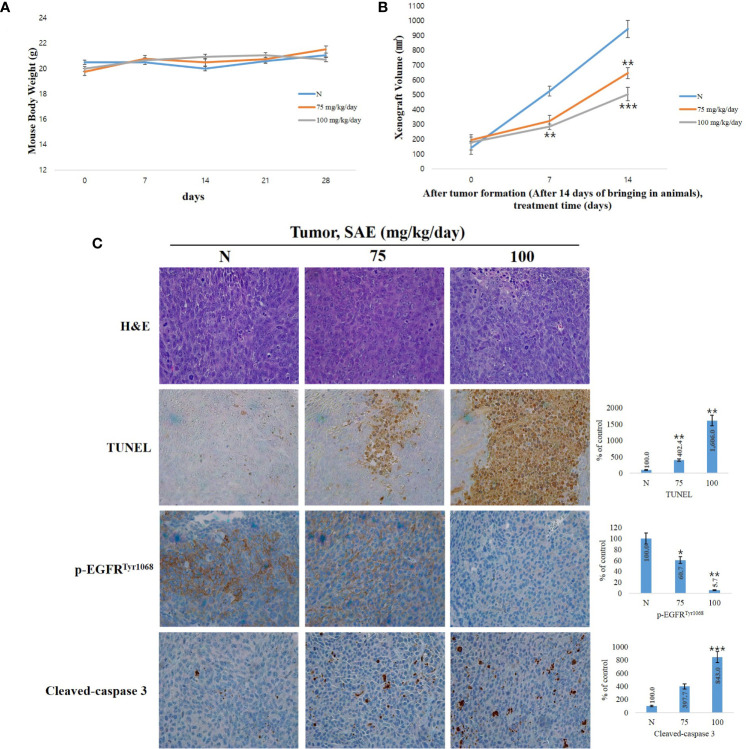
Figure 6.
SAE suppresses tumor growth in vivo. (A) Measurement of body weight. (B) Measurement of tumor size. SAE treated groups (75 or 100) were compared against untreated groups (N). Statistical analyses were performed using t-tests; *p < 0.05, **p < 0.01, ***p < 0.001. N.S., not significant. (C) H&E staining, TUNEL assay and immunohistochemistry (IHC) of specific proteins (p-EGFR, cleaved-caspase 3). Tumor sections were observed using an optical microscope at ×400. All images were quantitatively represented using ImageJ (National Institutes of Health). Statistical analyses were performed using t-tests; *P<0.05, **P<0.01, ***p < 0.001 compared to N groups (each experiment, n= 3). The error bars represent the standard error. N, Negative control; 75, SAE 75 mg/kg/day; 100, SAE 100 mg/kg/day.

