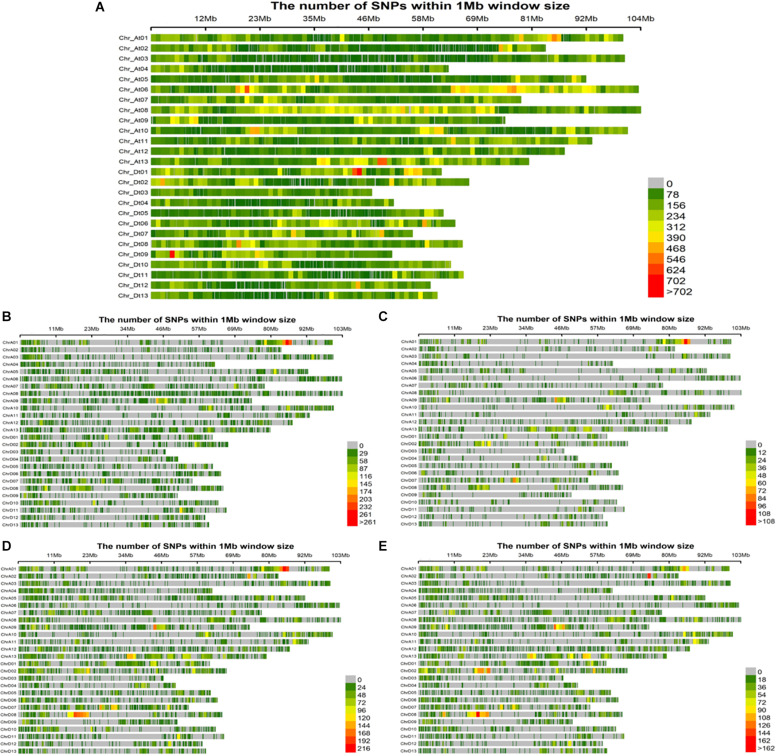
FIGURE 4.
Single nucleotide polymorphism (SNP) distributions on 26 chromosomes of (A) parents, (B) F1_A, (C) F1_C, (D) F1_D, and (E) F1_E. At1∼At13 and Dt1∼Dt13 in vertical axis are the serial number of 26 chromosomes; the horizontal axis shows chromosome length (Mb); = 0 ∼>702 depicts SNP density (the number of SNPs per window).

