FIGURE 1.
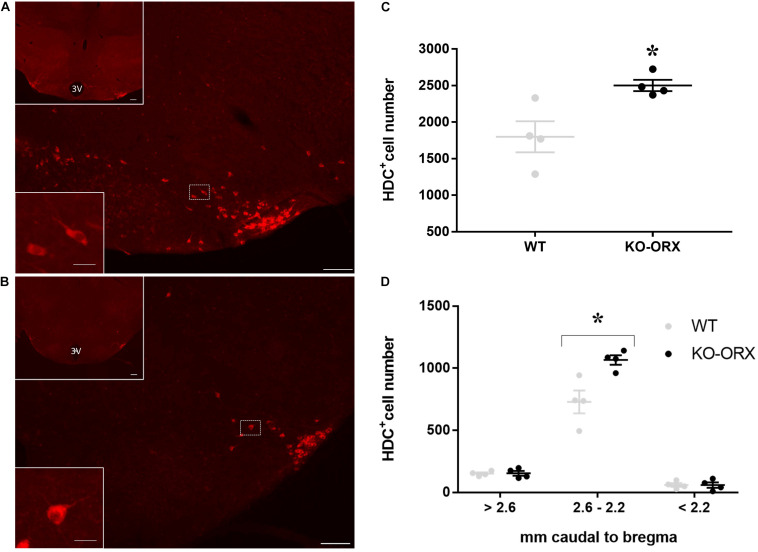
L-histidine decarboxylase-positive cells in orexin knockout and wild-type mice. (A,B) Show representative sections of L-histidine decarboxylase (HDC) immunostaining (cells with red cytoplasm) in orexin knockout (KO-ORX), and control wild-type (WT) mice, respectively. In both panels, the bottom left insets show a higher magnification of the delimited area (white square) in the main panel. 3V: third ventricle. Scale bars = 100 μm for main panels and upper insets and 12.5 μm for the lower insets. For the sole purpose of figure publication, the contrast, and brightness were adjusted to resemble the appearance of the labeling seen through the microscope using Adobe Photoshop CS3 Extended 10.0 software (Adobe Systems, San Jose, CA, United States). (C) Shows the total number of HDC- positive neurons in four WT control and four KO-ORX mice. (D) Shows the number of HDC-positive neurons in four KO-ORX and four WT mice as a function of distance from bregma along the rostrocaudal axis, with reference to the mouse brain atlas (Franklin and Paxinos, 2007). Gray and black dots represent individual animals. The horizontal line and whiskers indicate means ± SEM. *P < 0.05 vs. WT, one-sample independent t-test.

