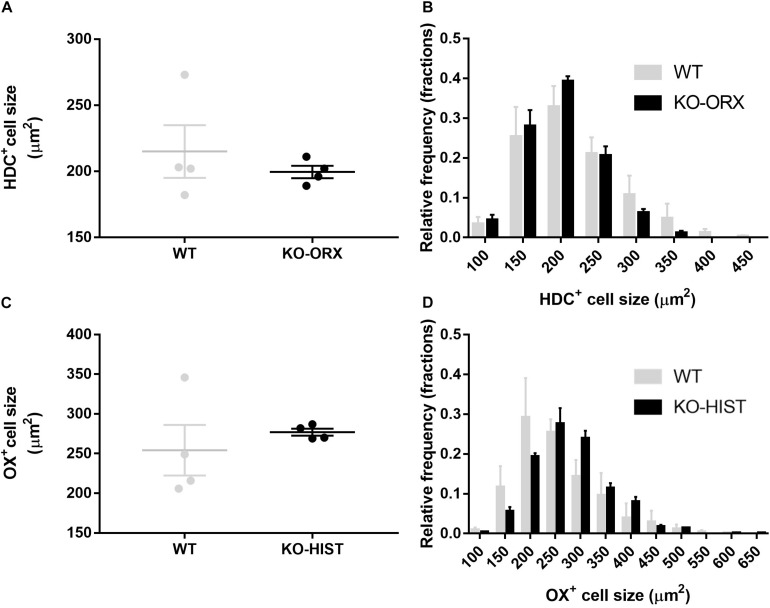
FIGURE 3.
L-histidine decarboxylase-positive and orexin-A positive cell size. (A) Shows HDC-positive average cell size in four WT mice and four KO-ORX mice. (C) Shows average orexin-A positive cell size in four WT mice and four KO-HIST mice. Gray and black dots represent individual animals. (B) Shows the HDC-positive cell size distribution (50 μm2 bins, X axis) in four WT (gray) mice and four KO-ORX (black) mice. (D) Shows the orexin-A positive cell size distribution (50 μm2 bins, X axis) in four WT (gray) mice and four KO-HIST (black) mice. (A,C) The horizontal line and whiskers indicate means ± SEM. (B,D) Data are reported as mean + SEM.

