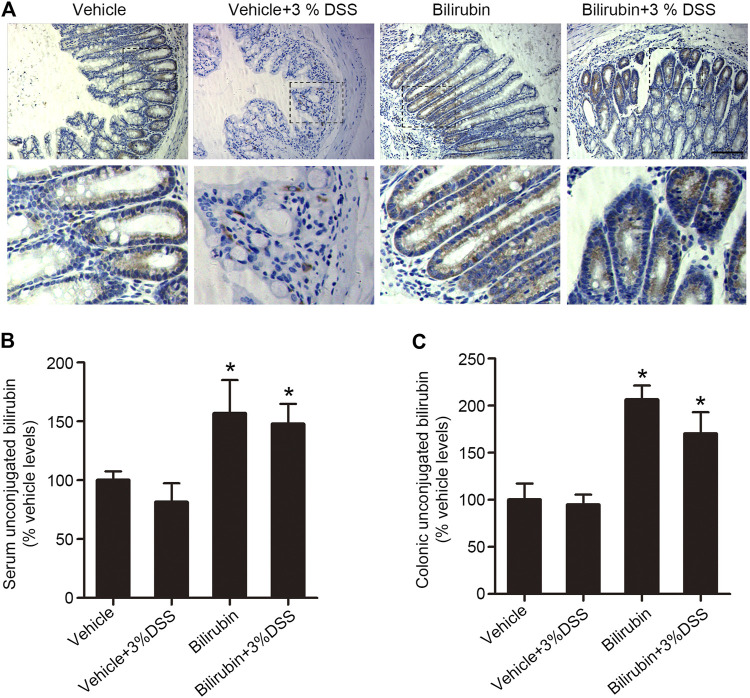
FIGURE 3.
UCB increased plasma and proximal colonic bilirubin levels in the DSS-treated mice. (A) Representative images of proximal colon tissues immune-stained for bilirubin in the indicated groups. Bar = 100 μm. (B, C) UCB levels in the plasma (B) and cecal/proximal colon homogenates (C) as measured by LC-MS/MS. Data are expressed as percentage of controls (vehicle). Each bar represents the mean ± SEM (n = 6); *p < 0.05 vs. the vehicle group.

