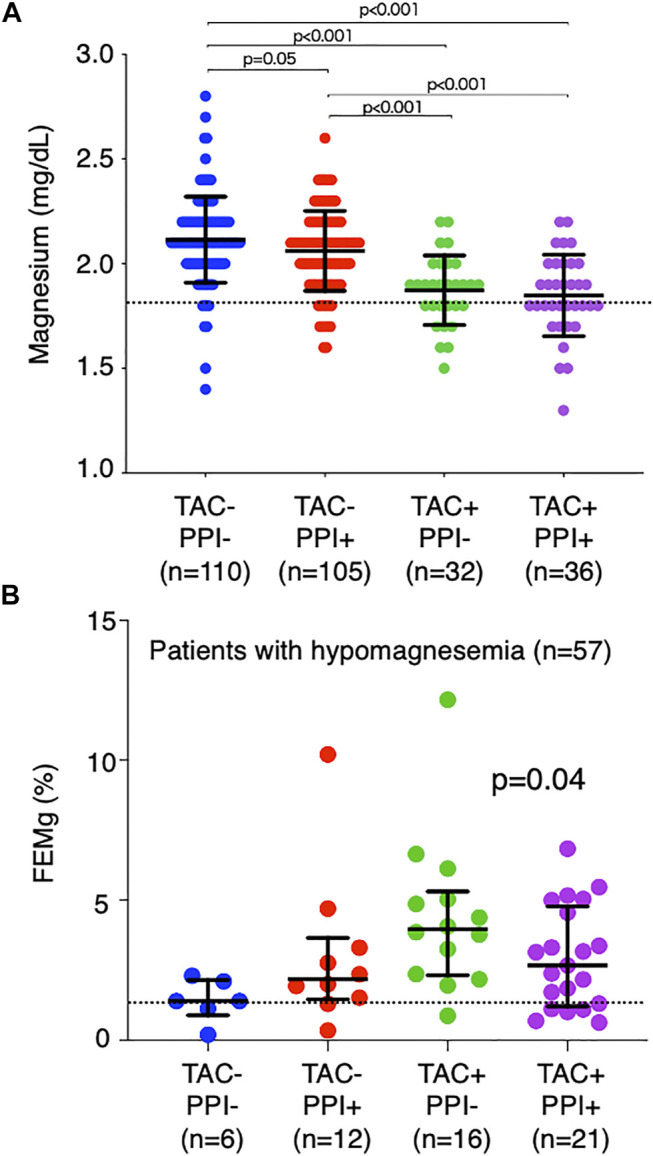
FIGURE 1.

Comparison of magnesium level and fraction excretion of magnesium by drug. All patients were divided into four groups according to TAC and PPI use. (A) Comparison of serum Mg levels among the four groups. The dotted line indicates the normal limit of the magnesium level (1.8 mg/dl). (B) Comparison of FEMg in patients with hypomagnesemia (n = 57). The dotted line indicates the normal limit of FEMg (2.0%). TAC, tacrolimus; PPI, proton pump inhibitor; Mg, magnesium; FEMg, fractional excretion of magnesium.
