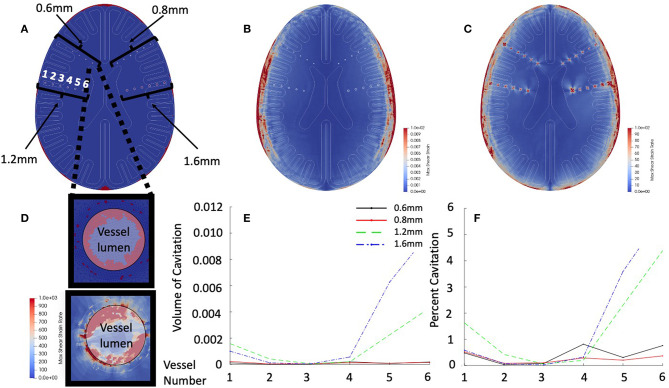
Figure 5.
Vascular simulation results at 2.5 ms. (A) Cross-section of vascular model. Highlighted are the vessel models of diameters of 0.6, 0.8, 1.2, and 1.6 mm. Vessels are numbered from lateral to medial position. (B) Shear strain maximum in early time simulation. (C) Shear strain rate in early time simulation. (D) Intravascular cavitation events of 0.6 mm vessel –position 6 (top). Focal strain rates within vessel wall (bottom). (E) Total vessel cavitation volume as function of position and diameter. (F) Percent of vessel volume cavitation as a function of position and diameter.

