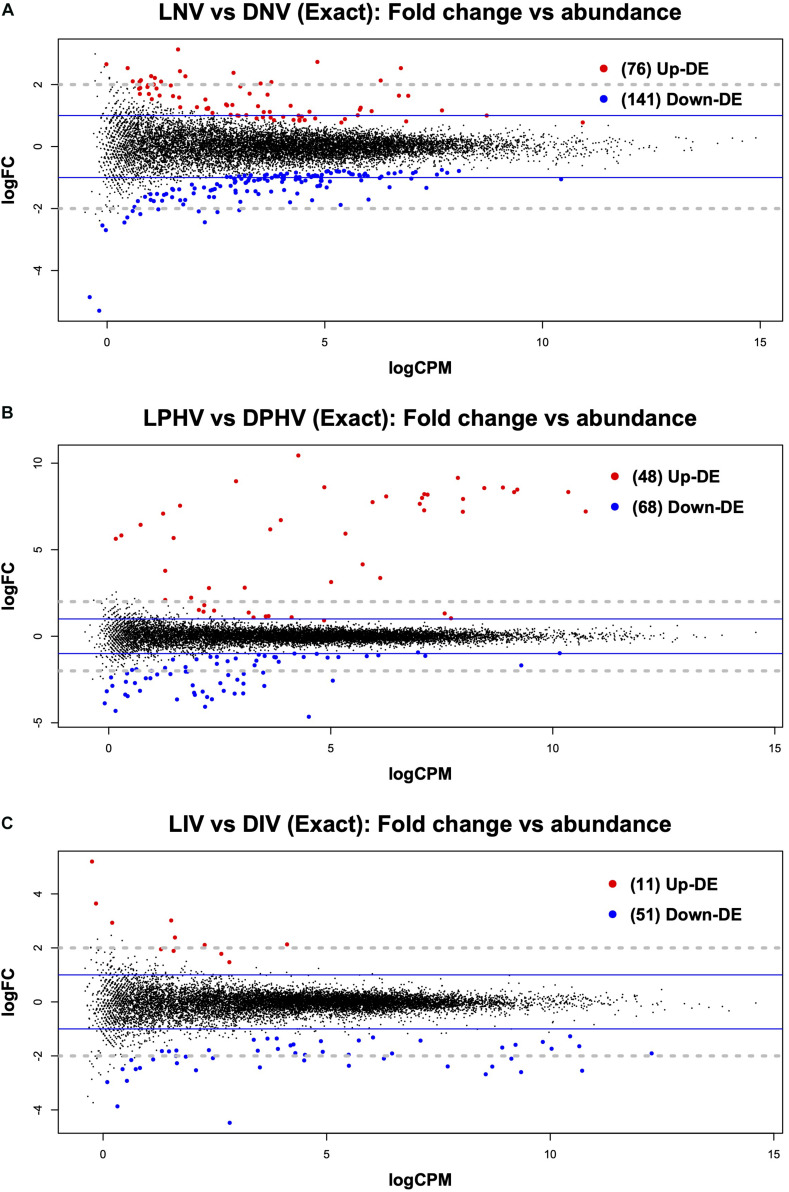
FIGURE 1.
Mean average (MA) plot highlighting the log fold change and average abundance of each gene in pre- vs. post-hatch spleen transcriptome comparison. Significantly up and down DE genes and their counts are highlighted in red and blue, respectively. (A) Shows the DEGs in the embryonic spleen (E18) during green monochromatic light biostimulation pre-hatch in LNV vs. DNV treatment groups. (B) Shows the DEGs in spleen tissue post hatch (D7) in LPHV vs. DPHV treatment groups that received vaccination post hatch on day one. (C) Shows the DEGs in spleen tissue post hatch (D7) in LIV vs. DIV treatment group received in ovo vaccination E18. The Y-axis corresponds to the mean average of log10 count per million (CPM), and the X-axis displays the log2 FC, with significance assessed at FDR < 0.05. LNV, light not vaccinated; DNV, dark not vaccinated; LPHV, light post-hatch vaccinated; DPHV, dark post-hatch vaccinated; LIV, light in ovo vaccinated; DIV, dark in ovo vaccinated.

