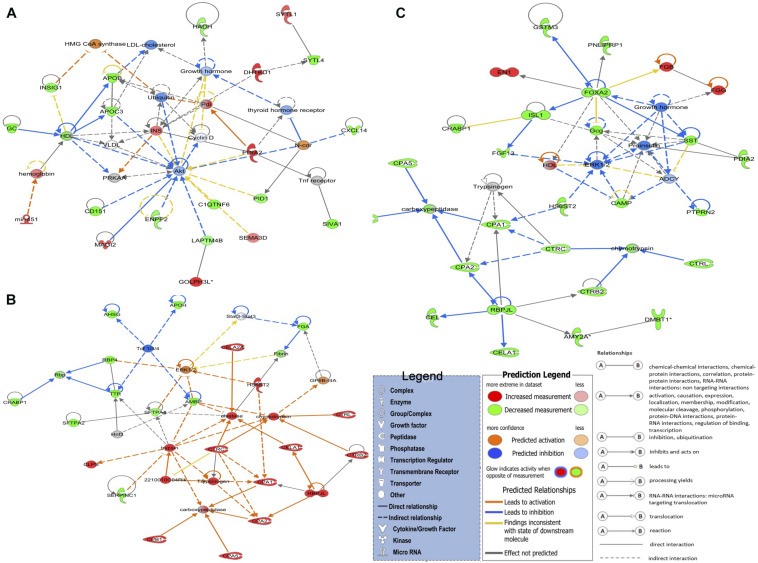
FIGURE 2.
The top three detected gene networks underline the affected genes in green monochromatic light biostimulation comparisons during incubation and their interaction in potentially regulating developmental biological processes pre- and post-hatch generated by QIAGEN’s Ingenuity Pathway Analysis (IPA, QIAGEN Inc.) (Krämer et al., 2014). (A) LNV vs. DNV gene network for cell morphology, digestive system development and function, and organ morphology. (B) LPHV vs. DPHV gene network for carbohydrate metabolism, lipid metabolism, and protein synthesis. (C) LIV vs. DIV gene network for developmental disorder, hematological disease, and hereditary disorder. Differentially expressed genes in the biostimulated comparisons were used in the ingenuity pathway analysis, and significant gene networks based on IPA scores were identified. Genes highlighted in red were upregulated, while those highlighted in green were downregulated in all biostimulated comparisons.

